Process Guide: Replicating Issues
Last updated: March 26, 2026
Developers often begin the debugging process by trying to replicate the issue, a path that often leads to frustration and wasted time. Factors like varying operating systems, browser types, browser versions, settings, and cache storage can make replicating a simple issue a time consuming–or impossible–process. While bug replication is a useful practice for uncovering the root cause of an issue, Noibu has a collection of debugging tools that provide many of the same insights that come from replication. Before getting too far into the replication process, consider the following:
Is the error an HTTP error or a JavaScript error?
The issue's title in Noibu should identify its nature.
How much data has been collected on the issue to date?
Review the issue's Overview tab for a summary of data collected to date.
Does the error seem to be a Browser or an OS specific error?
Review the Browser & OS Impact sections to assess its impact.
How much time do you have to investigate the issue?
Are there any immediate clues that identify possible root causes?
Does the timing of the error correlate to the timing of updates to the code?
Check out the Occurrences chart to see when the issue first appeared.
Replicating Issues with Noibu (Emulator Method)
Replication is a useful debugging strategy, but we recommend using replication in tandem with Noibu's debugging features for a smooth, efficient process. This method calls for an emulator. We recommend the following services–both are free:
Select an issue and open the Overview tab. Note the most common Last Reproduction Steps and Top URLs.


Open the Sessions tab, and select a session with a high Friction Factor. (The Friction Factor is a scoring metric Noibu uses to measure the difficulty a user experiences during a session on an eCommerce site. Noibu calculates an issue’s Friction Factor based on session symptoms.)

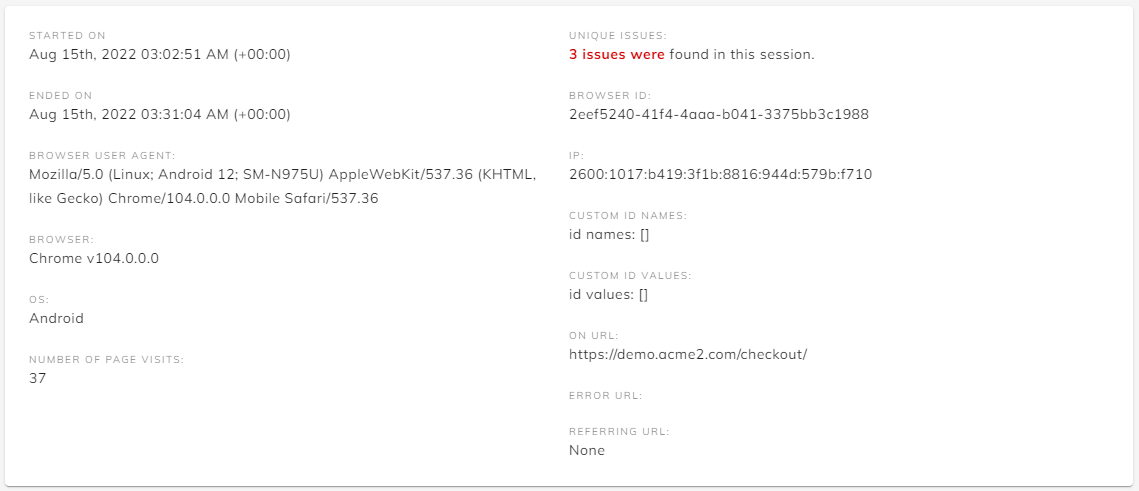
Open the Details tab. Note the session's Browser (including the version), Operating System (OS), and User Agent.
Use an emulator to match the Browser, OS, and User Agent.
Return to the Playback tab, and follow the exact steps the user took through the timeline, up until the error occurred.

Repeat steps 2-5 with several sessions until you replicate the error.
Check out our solutions for Managing Bot Traffic, Whitelisting Noibu on your CDN, and Debugging without a JavaScript File.