Issue Statistics tab
Last updated: April 15, 2026
The Statistics tab of the Issues page shows you a domain-wide average view of funnel performance over the period of time you select (Last 1, 7, 14, 30, or 90 days). Noibu reports the impact to conversion and revenue across the following four stages of a customer's purchase journey:
On Site: A customer has landed on your website.
Add to Cart: A customer has added an item to their cart.
Checkout Started: A customer has started the checkout process.
Place Order: A customer has clicked Place Order.
Funnel Statistics table

For each stage of the funnel, the Funnel table summarizes the number of unique sessions, and how many of those sessions were able to progress to the next stage, within a given timeframe. You can adjust the table to pull data over the past day, or the past 7, 14, 30, or 90 days.
The table also reports the Sessions Lost and Transactions Lost at each stage. These totals are calculated as follows:
Sessions Lost = Total Sessions X Drop in Conversion
Transactions Lost = Sessions Lost X Domain Average Conversion Rate for the remaining steps up to Checkout Started
It's natural to have some drop-off at each stage of the purchase journey. However, by collecting data to calculate an average conversion rate, the Funnel Statistics view calculates how many sessions and transactions were lost due to issues on your website. It also estimates how much revenue you could stand to lose at each stage if the issues go unaddressed.
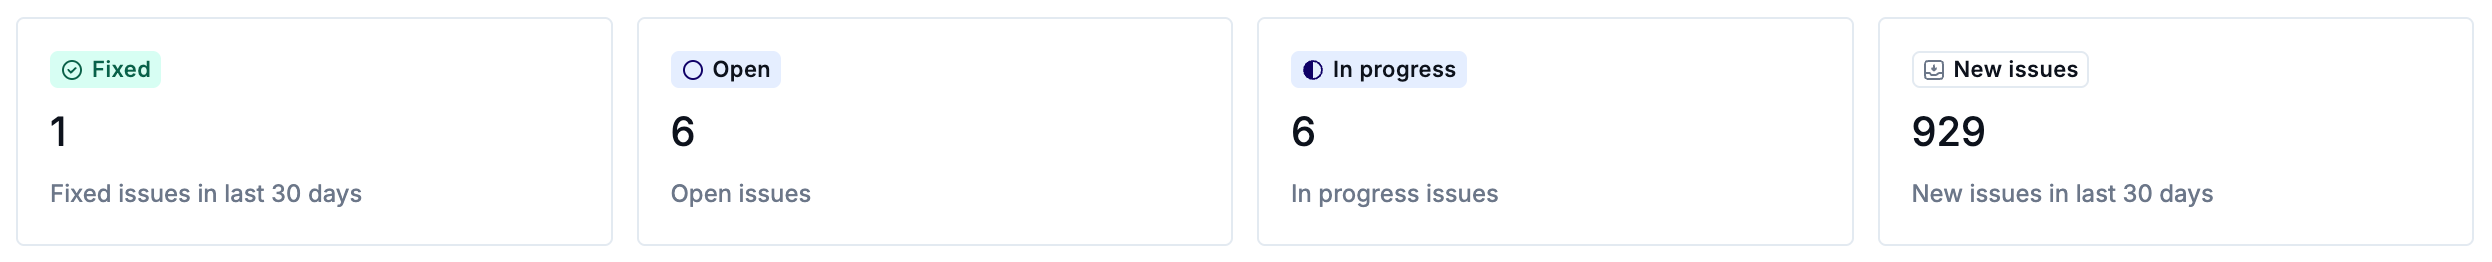
Issue Status Summary
This section shows you a total count of issues for all time grouped by status: new, open, in progress, and fixed. Clicking on any of these tiles will take you to the All Issues tab, filtered to the relevant status.
Funnel Analysis
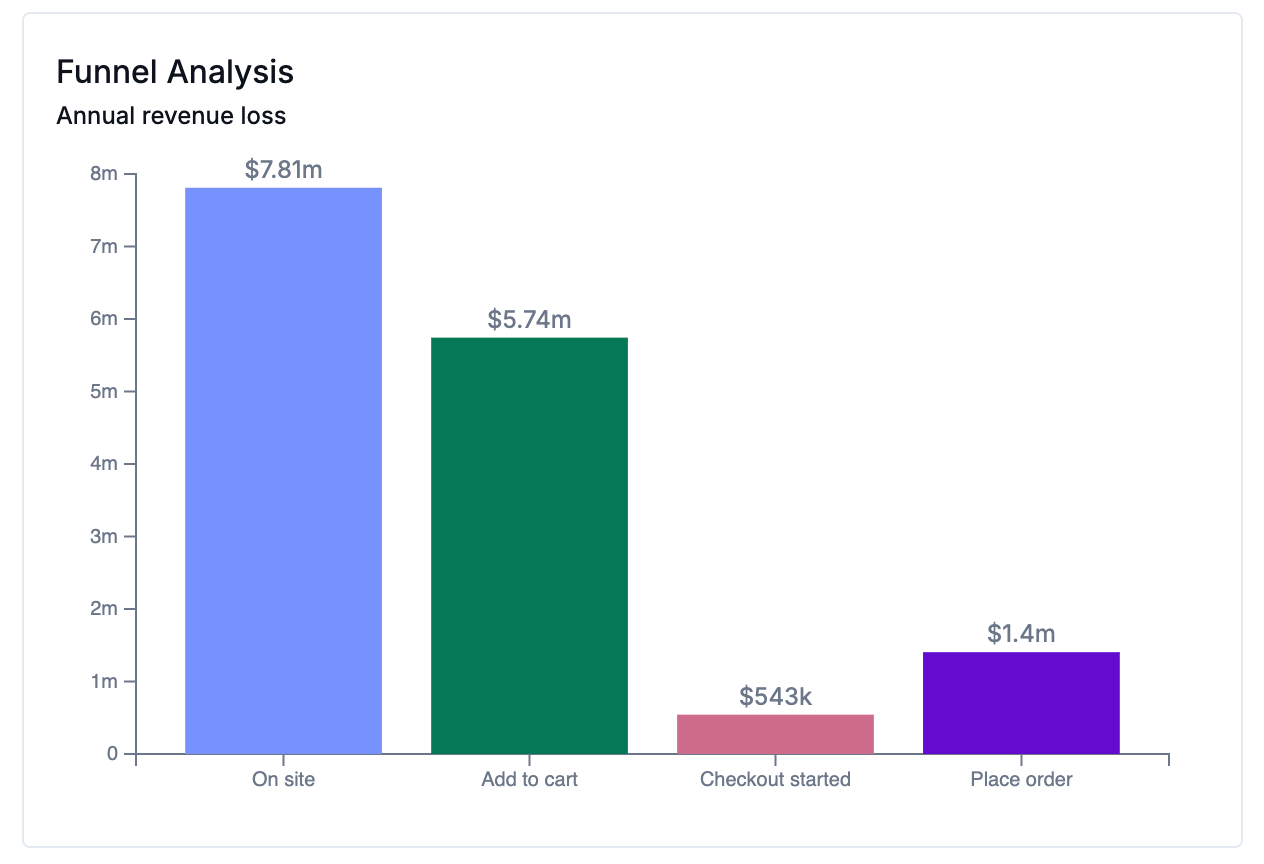
The Funnel Analysis chart pulls Annualized Revenue Loss totals from the Funnel, and provides a quick look at the ARL estimates at each funnel step within the timeframe selected.
The chart visually represents how much money you stand to lose at each stage of this journey due to errors, which may help focus your debugging efforts. For example, if a majority of revenue loss happens due to errors at the Place Order stage, there's clearly one or more egregious errors affecting that part of the checkout.
Click on a bar to open a list of funnel issues causing revenue loss at the given stage.
Progression Rate
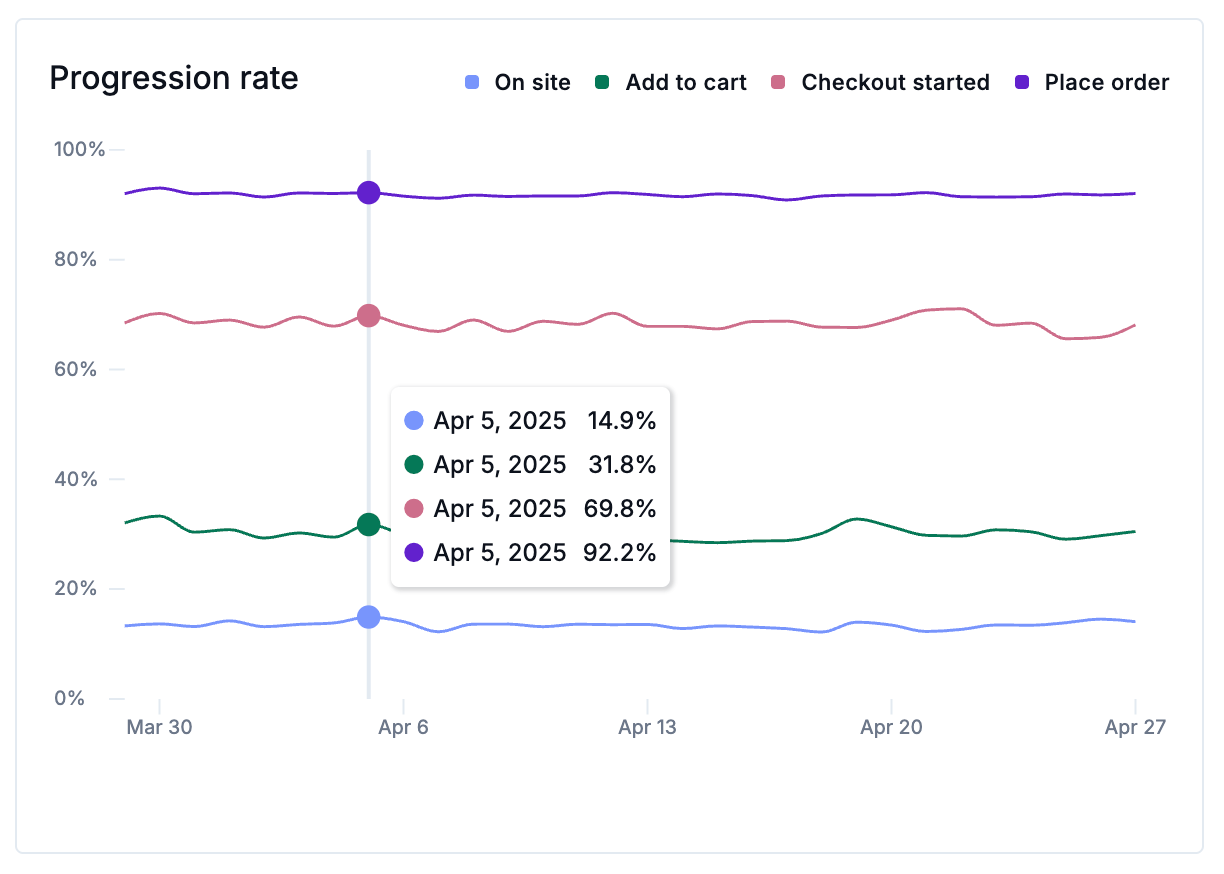
The Progression Rate chart represents that number of sessions in each funnel step, by percentage, that progressed to the next stage of the purchase journey. It's natural to have some drop-off at each stage. A customer browsing an online store may never add anything to their cart, or they might add items to the cart but log off before checking out. Comparing the Progression Rate chart to the Funnel Analysis chart can help identify stages where a low progression rate corresponds with high revenue loss.
Revenue impact
The bottom of this page summarizes the annual revenue saved and projected annual revenue loss for the time period selected.
Annual revenue saved: the total annual revenue loss of issues marked Closed-Fixed within the time period selected.
Annual revenue loss: the total annual revenue loss of all issues detected by Noibu for the time period selected.
Learn more about how Noibu calculates Annual Revenue Loss.