Issue Resolution - Step 1: Gathering Data
Last updated: March 31, 2026
The first step towards resolving an error is to gather as much data as possible. This is where the Noibu toolbox comes in handy, and you can get started on tackling errors by collecting crucial context about the error from several key places in the platform.
When gathering data, open the issue's profile and review the following data sources:
Overview & Issue Management
The Issue Overview page provides a birds-eye view of the error, and help you answer some key questions:
What is the error's name and message? These may highlight the name of the function or variable that's causing the error, or allude to problematic code.
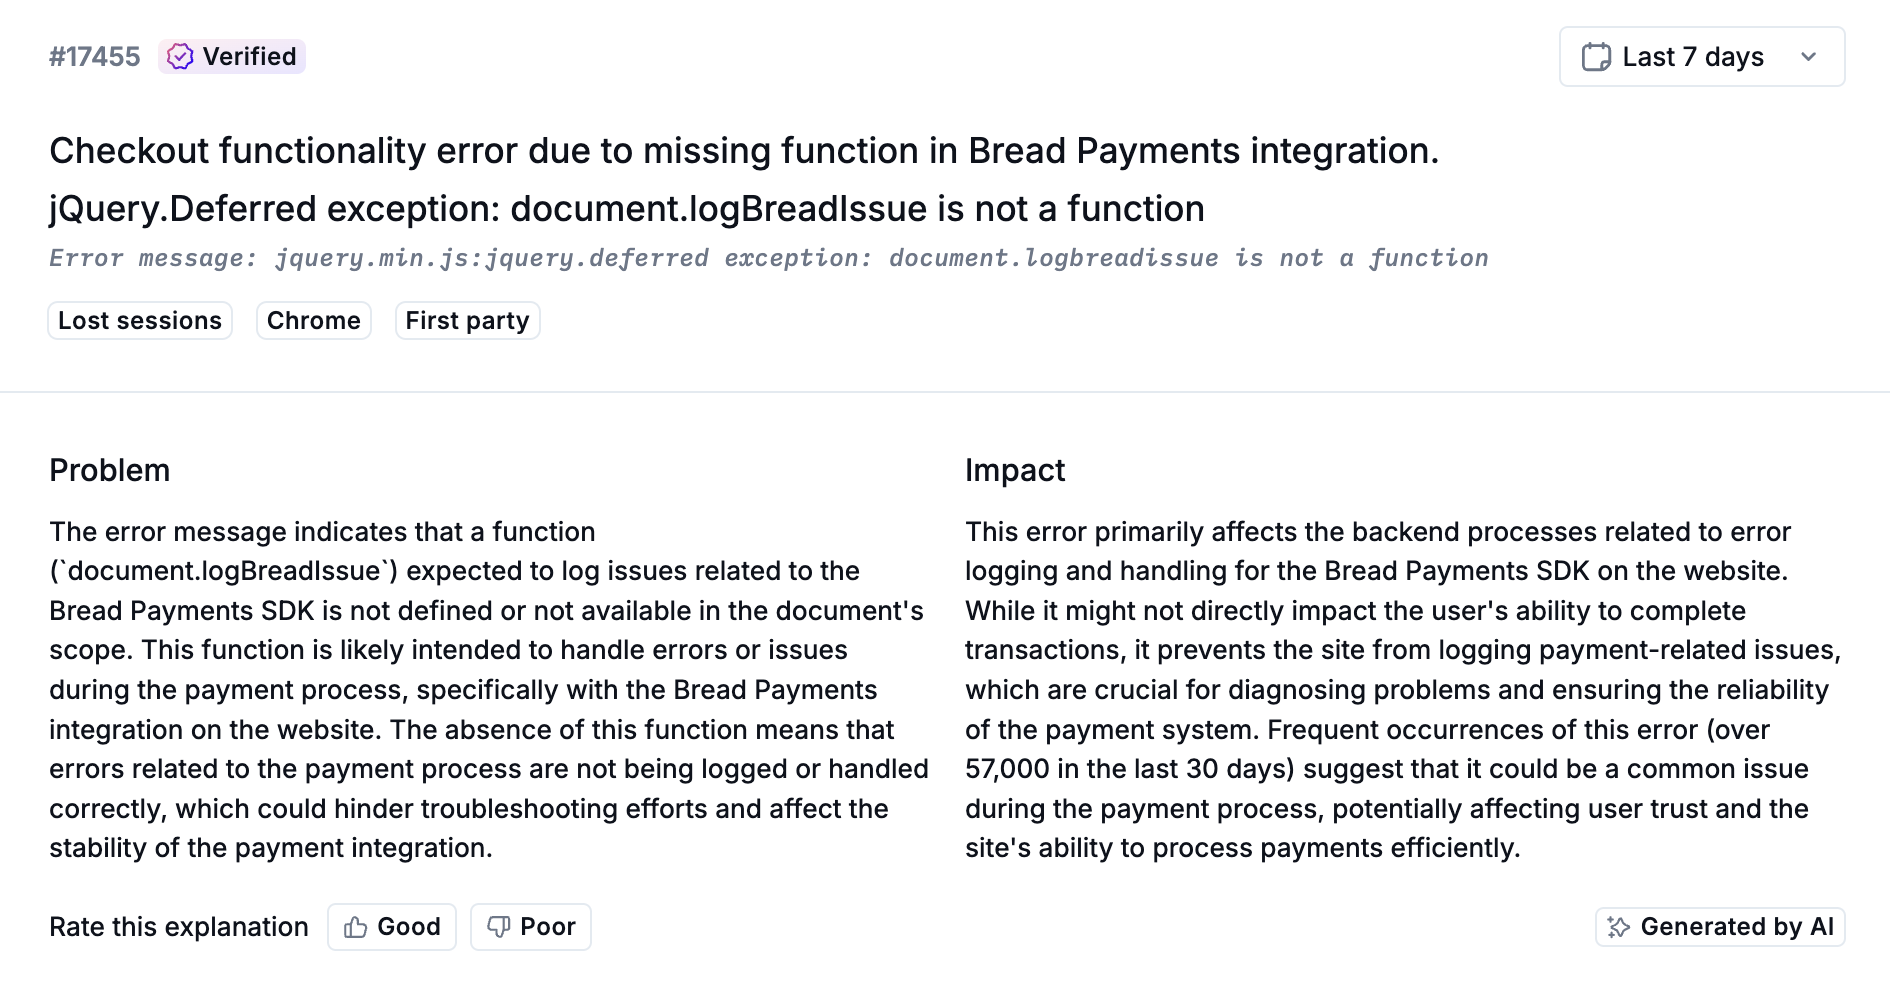
In which stage or stages of the funnel does the error occur? Does it happen in the cart? The checkout flow?
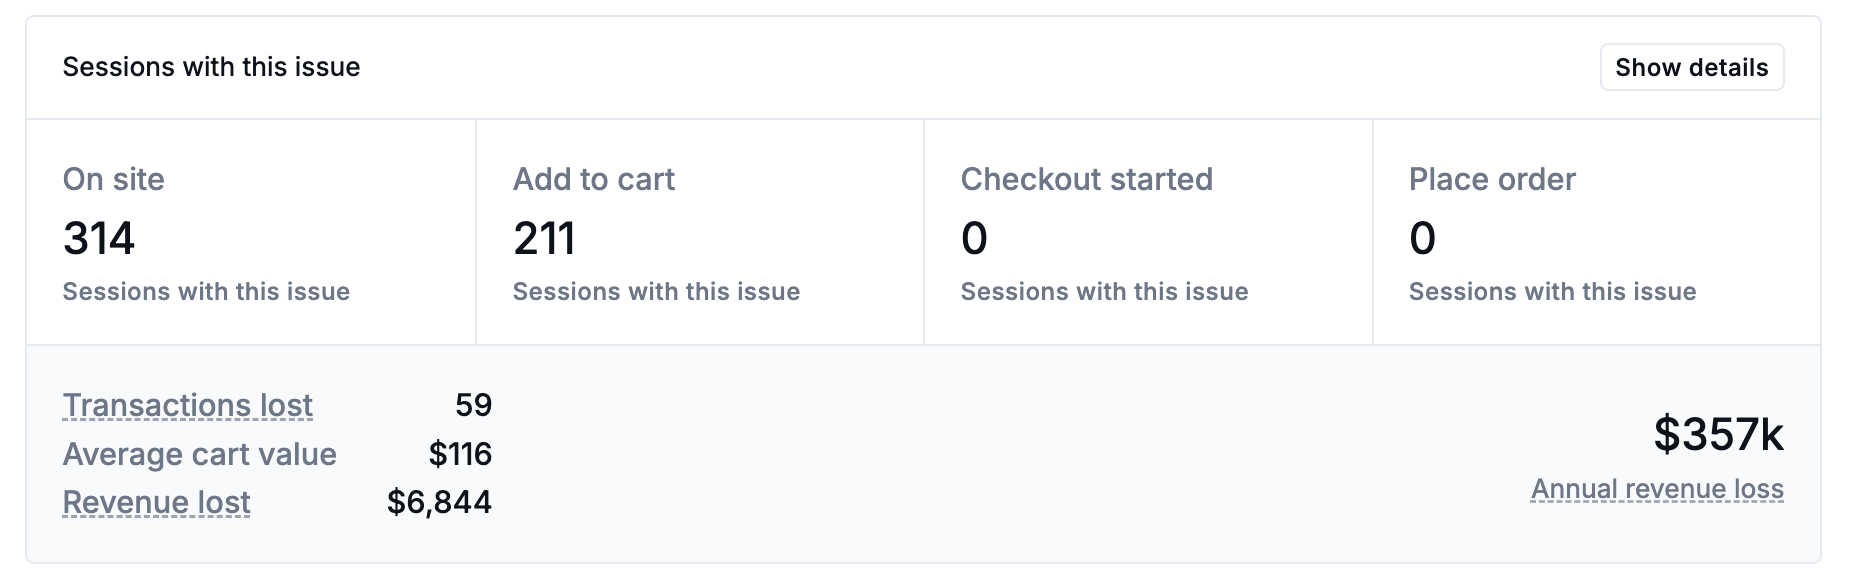
How does the error affect conversion?
What symptoms are users experiencing? Think about the problem these symptoms indicate.
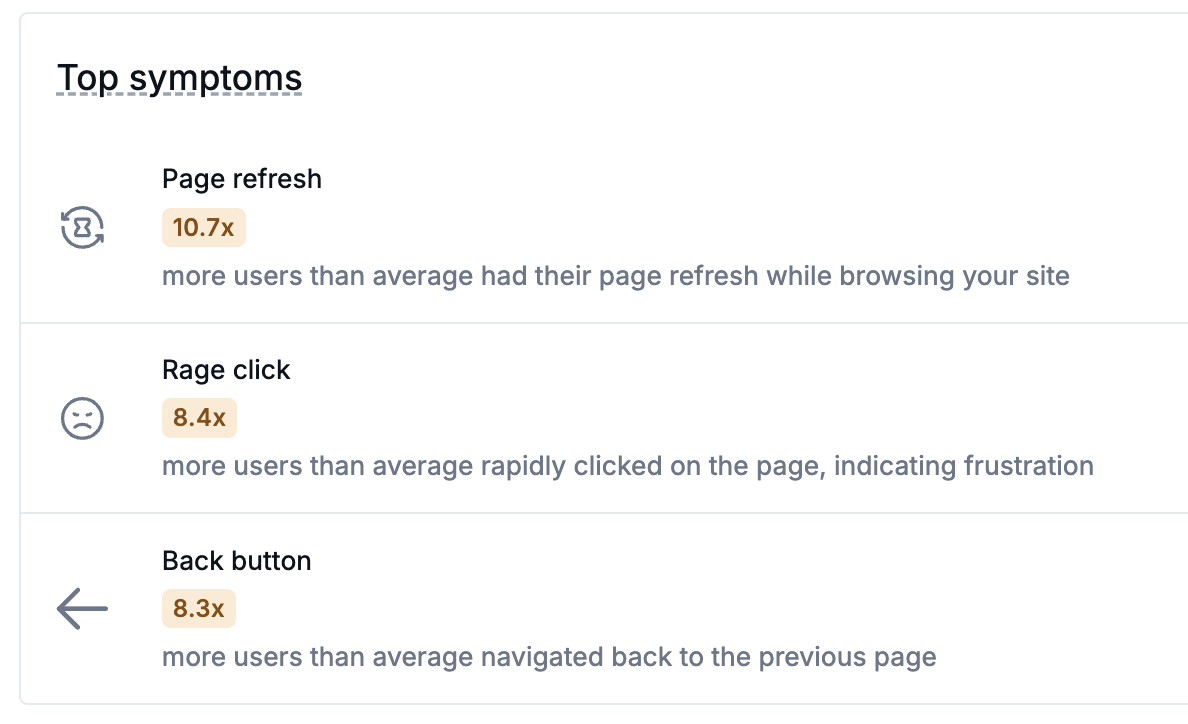
Example: Rage clicks indicate slow performance, refreshing or hitting the back button may indicate a failed load, and attempting multiple payment gateways indicates an issue with the payment flow.
When did the error start? Does this align with a recent release, maintenance, or code deployment?
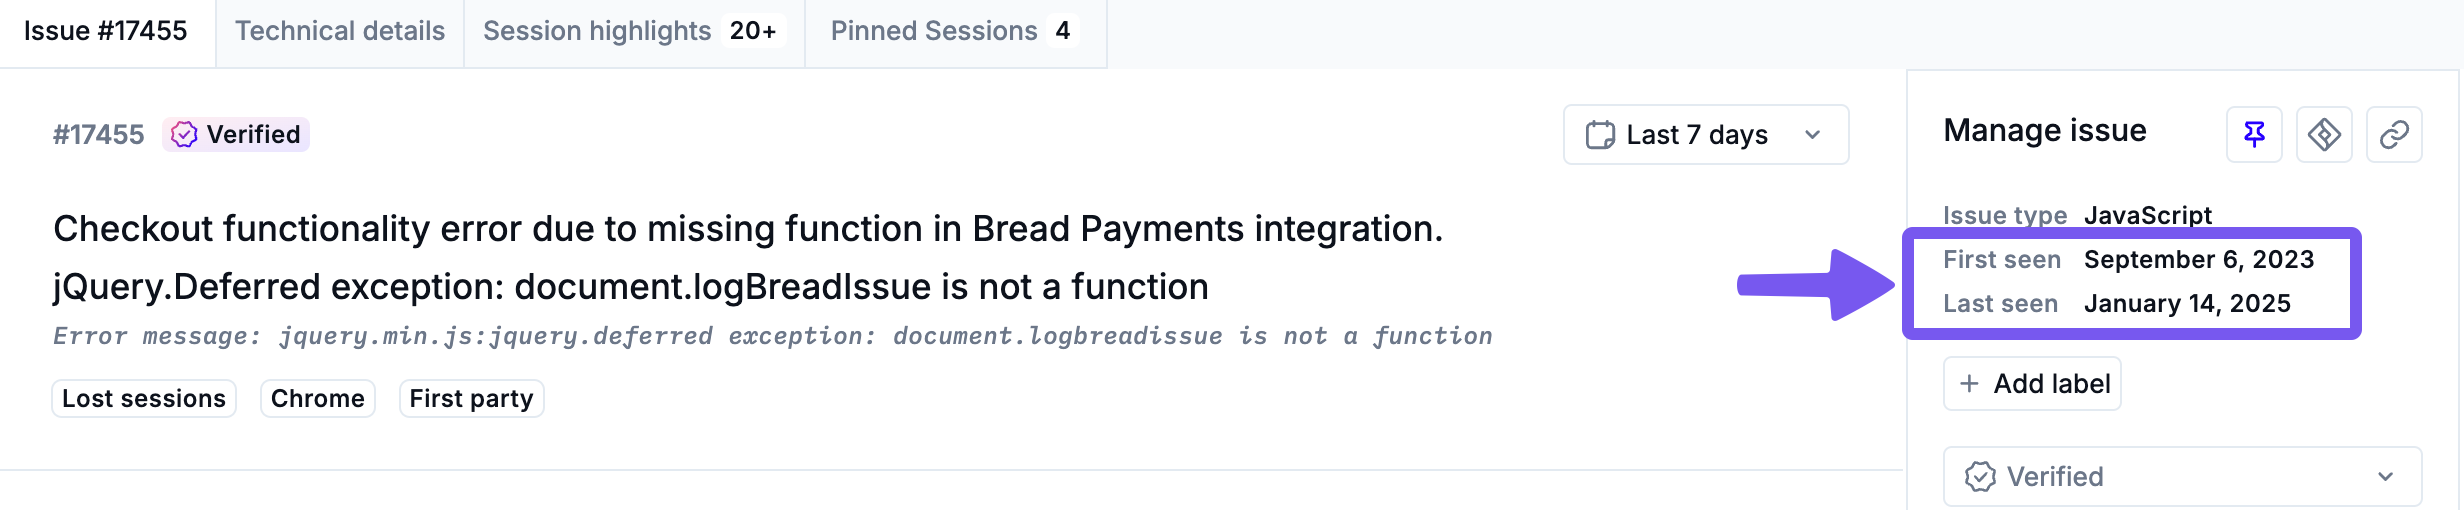
How often is the error occurring? Are occurrences trending up or down?
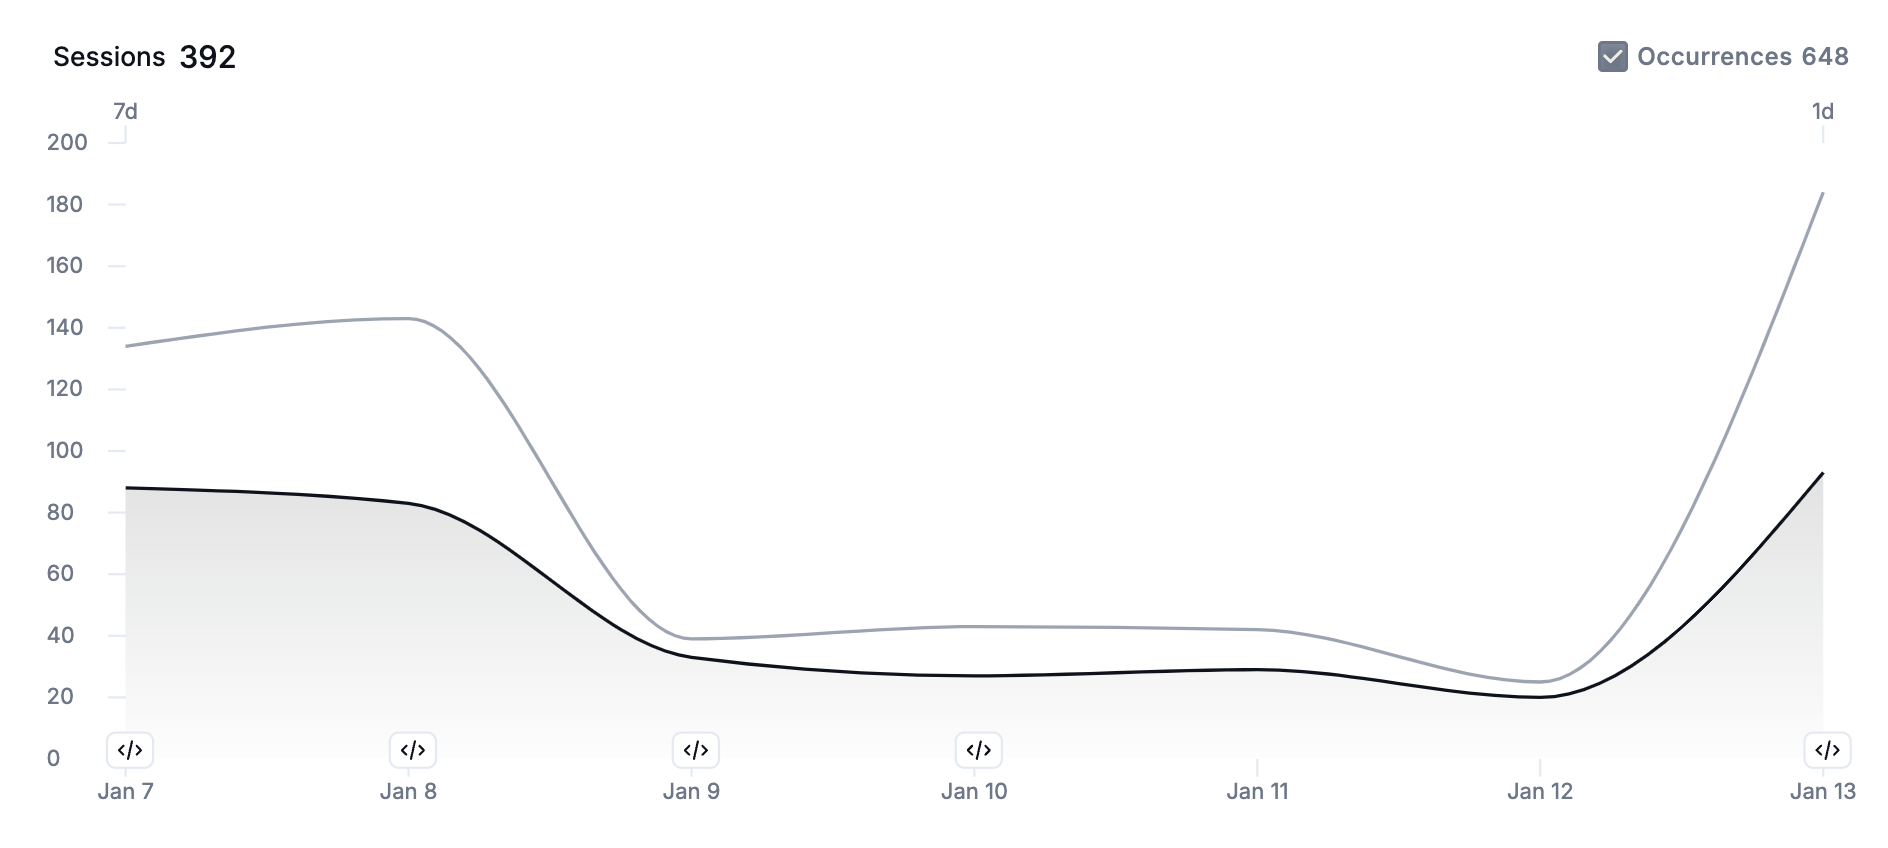
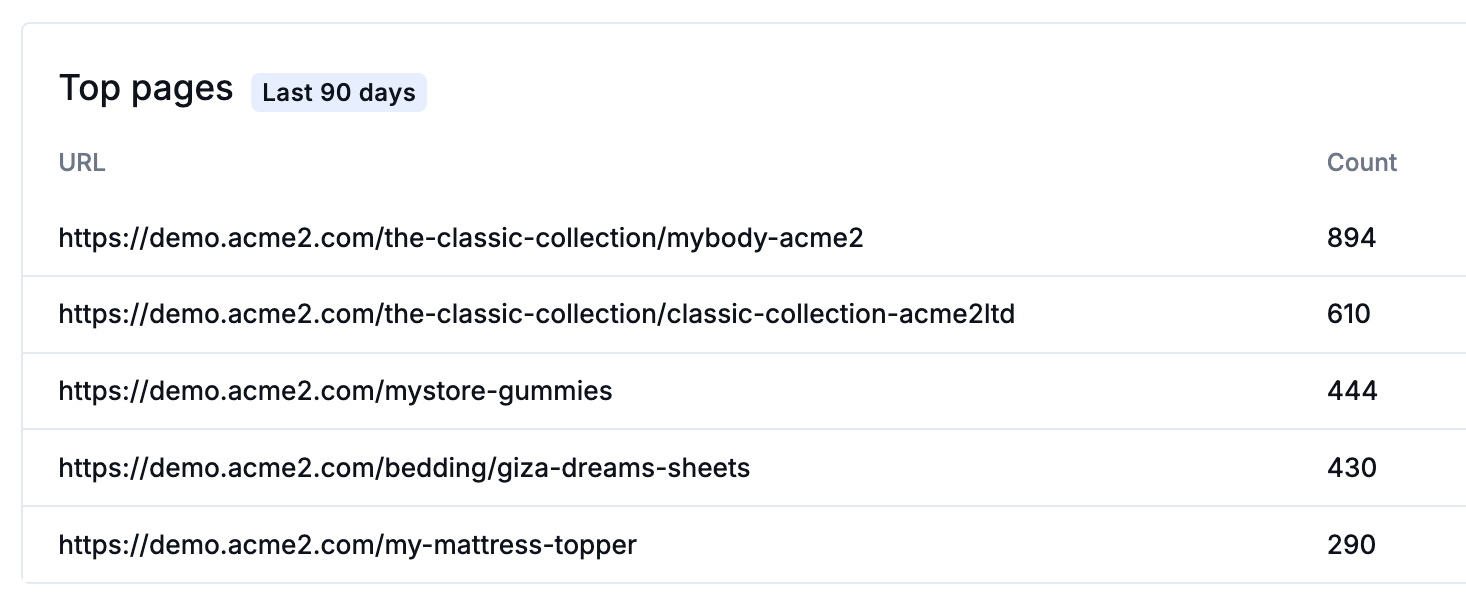
On which URLs does the error occur? This can help you identify WHERE the error occurs. Are there occurrences spread over multiple product pages, or do most happen at a specific point in the checkout flow?
With these basic details gathered, you're ready to move on to the Technical Details tab, where you'll find a wealth of technical information to aid your investigation.
Technical Details
The Technical Details tab presents technical information to help you dig into the error's nitty-gritty details. Here, you can answer such questions as:
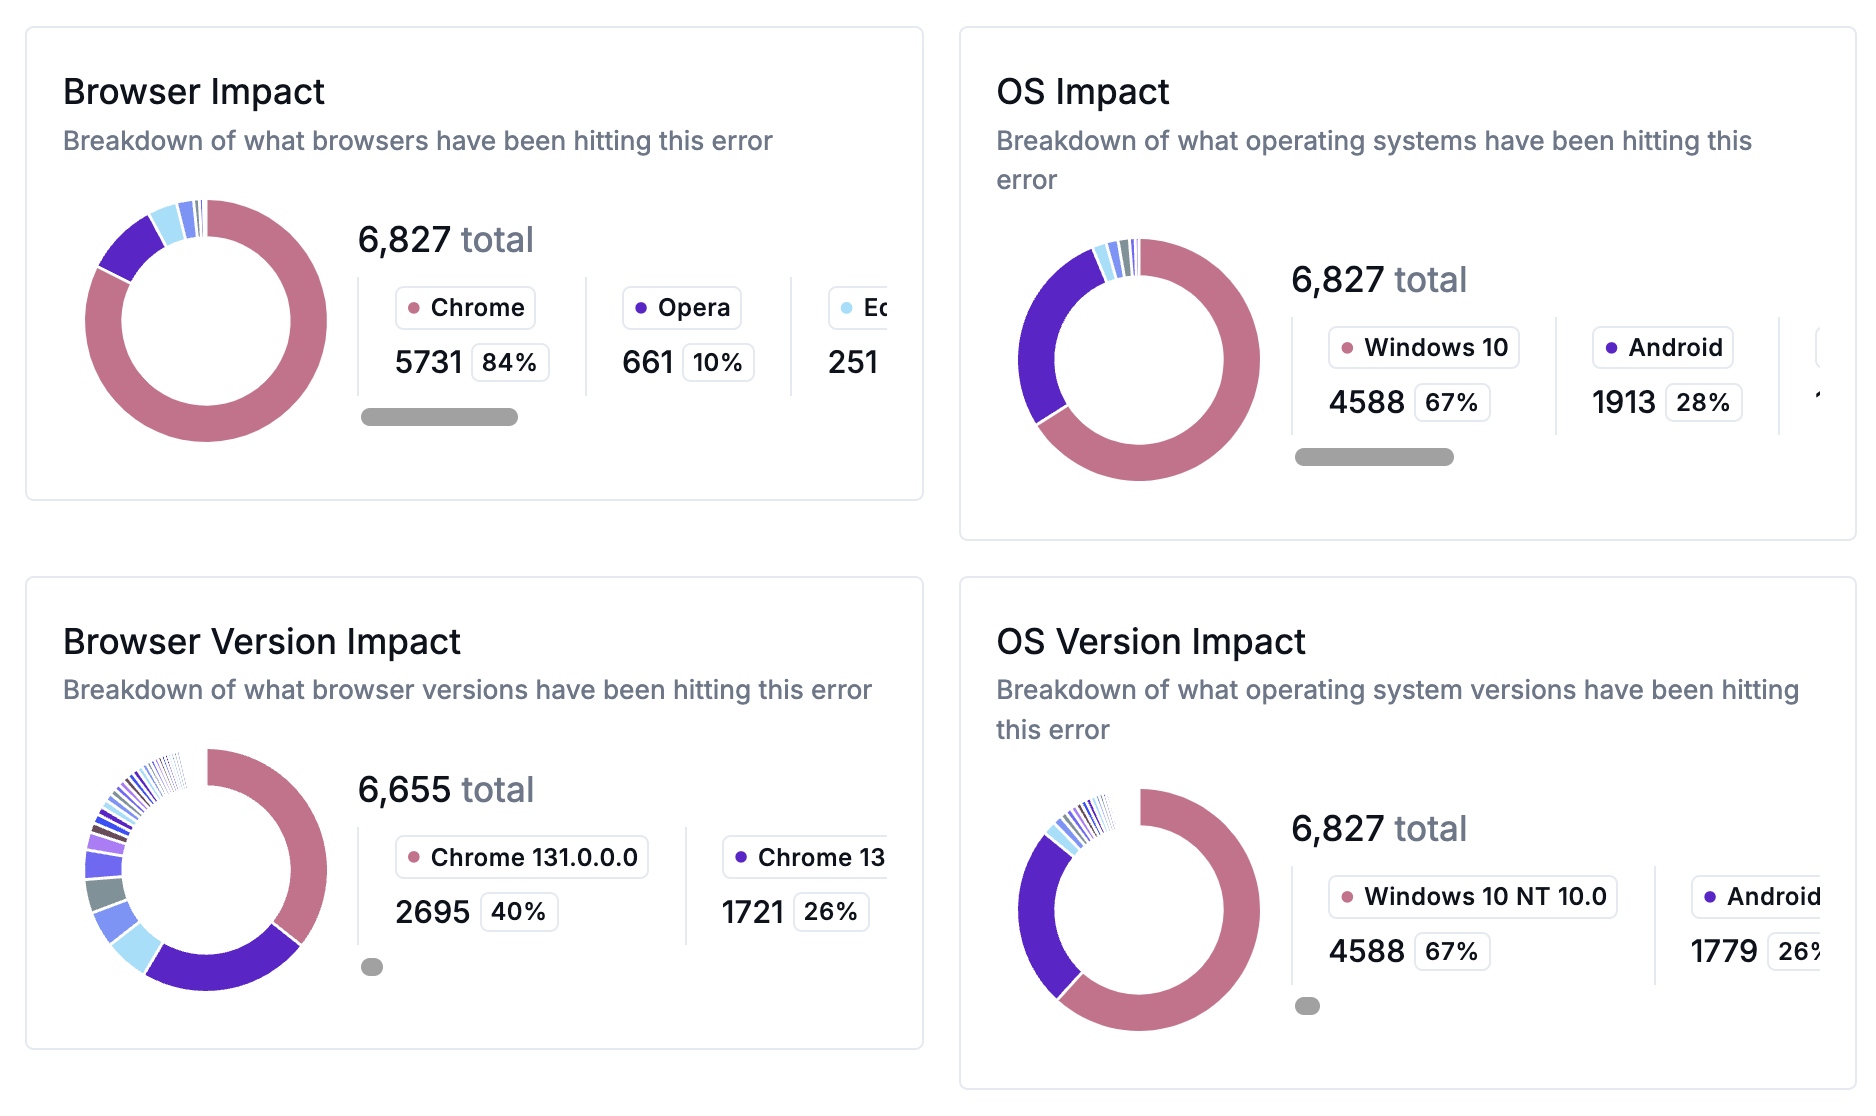
What browsers or operating systems do the error affect? Are most occurrences on a specific browser? Does the issue primarily affect mobile users?
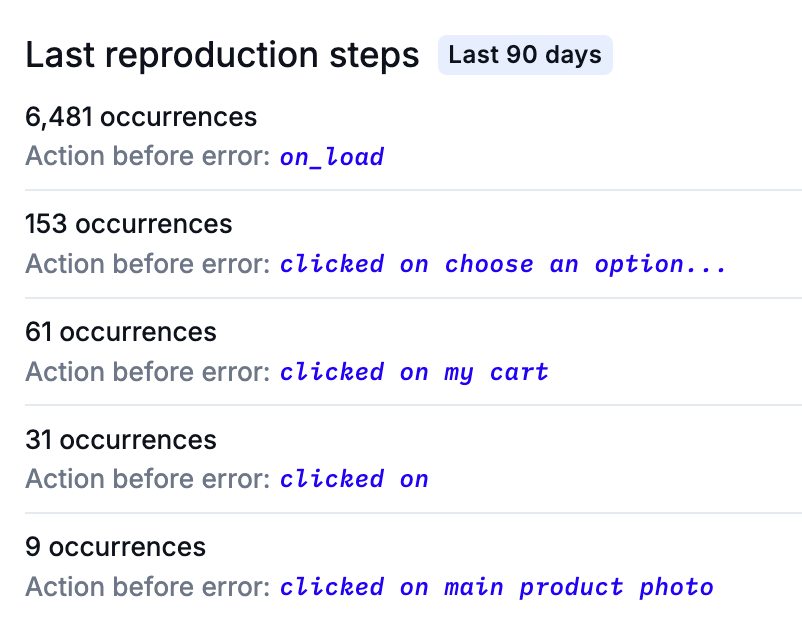
What are the last reproduction steps? What action or actions trigger the error?
What code insights can you collect about the error?
For JavaScript errors, consult the Stacktrace to find the specific line of code that triggers the error.
.png")
If the Stacktrace presents minified code, upload or link a Source Map to point to the unminified code.
For HTTP errors, consult the HTTP Error Details section and examine the header details.
.png")
HTTP collection must be enabled on a per-domain basis. To see this data, open the Domain module, select a domain, and check the Collect HTTP Data box on the Domain Details page.
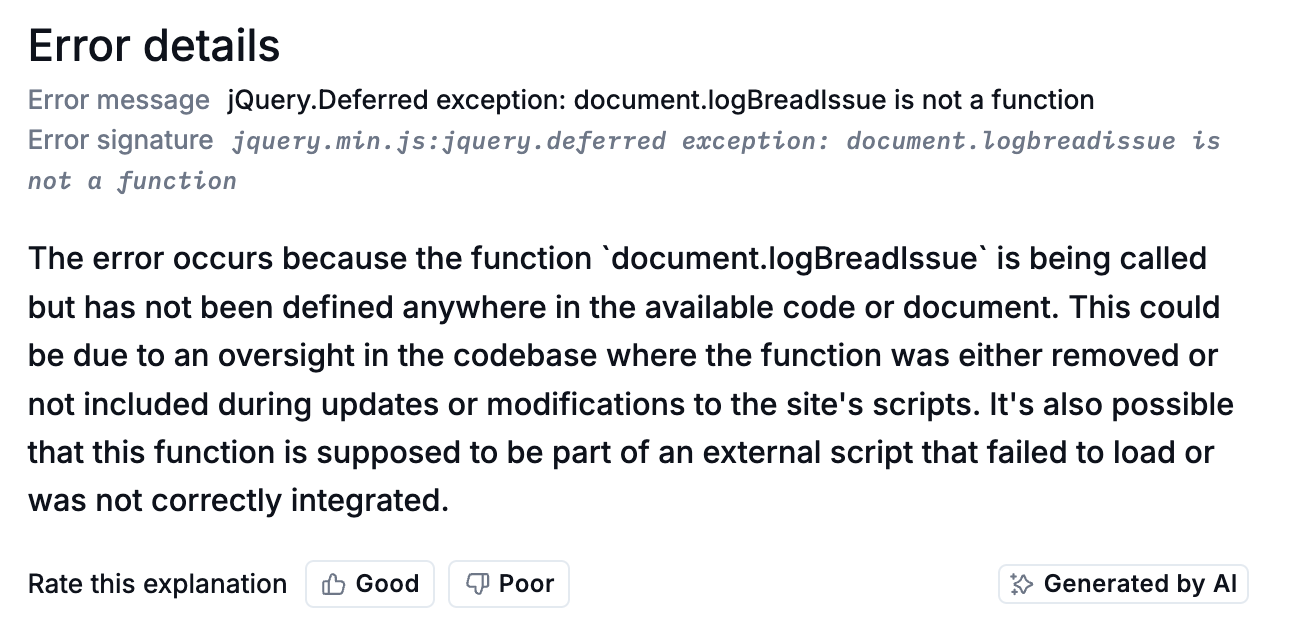
What information can you collect from the issue's AI-generated explanation?
Once you have some technical information, you should start watching session videos to see the error and its impact in action.
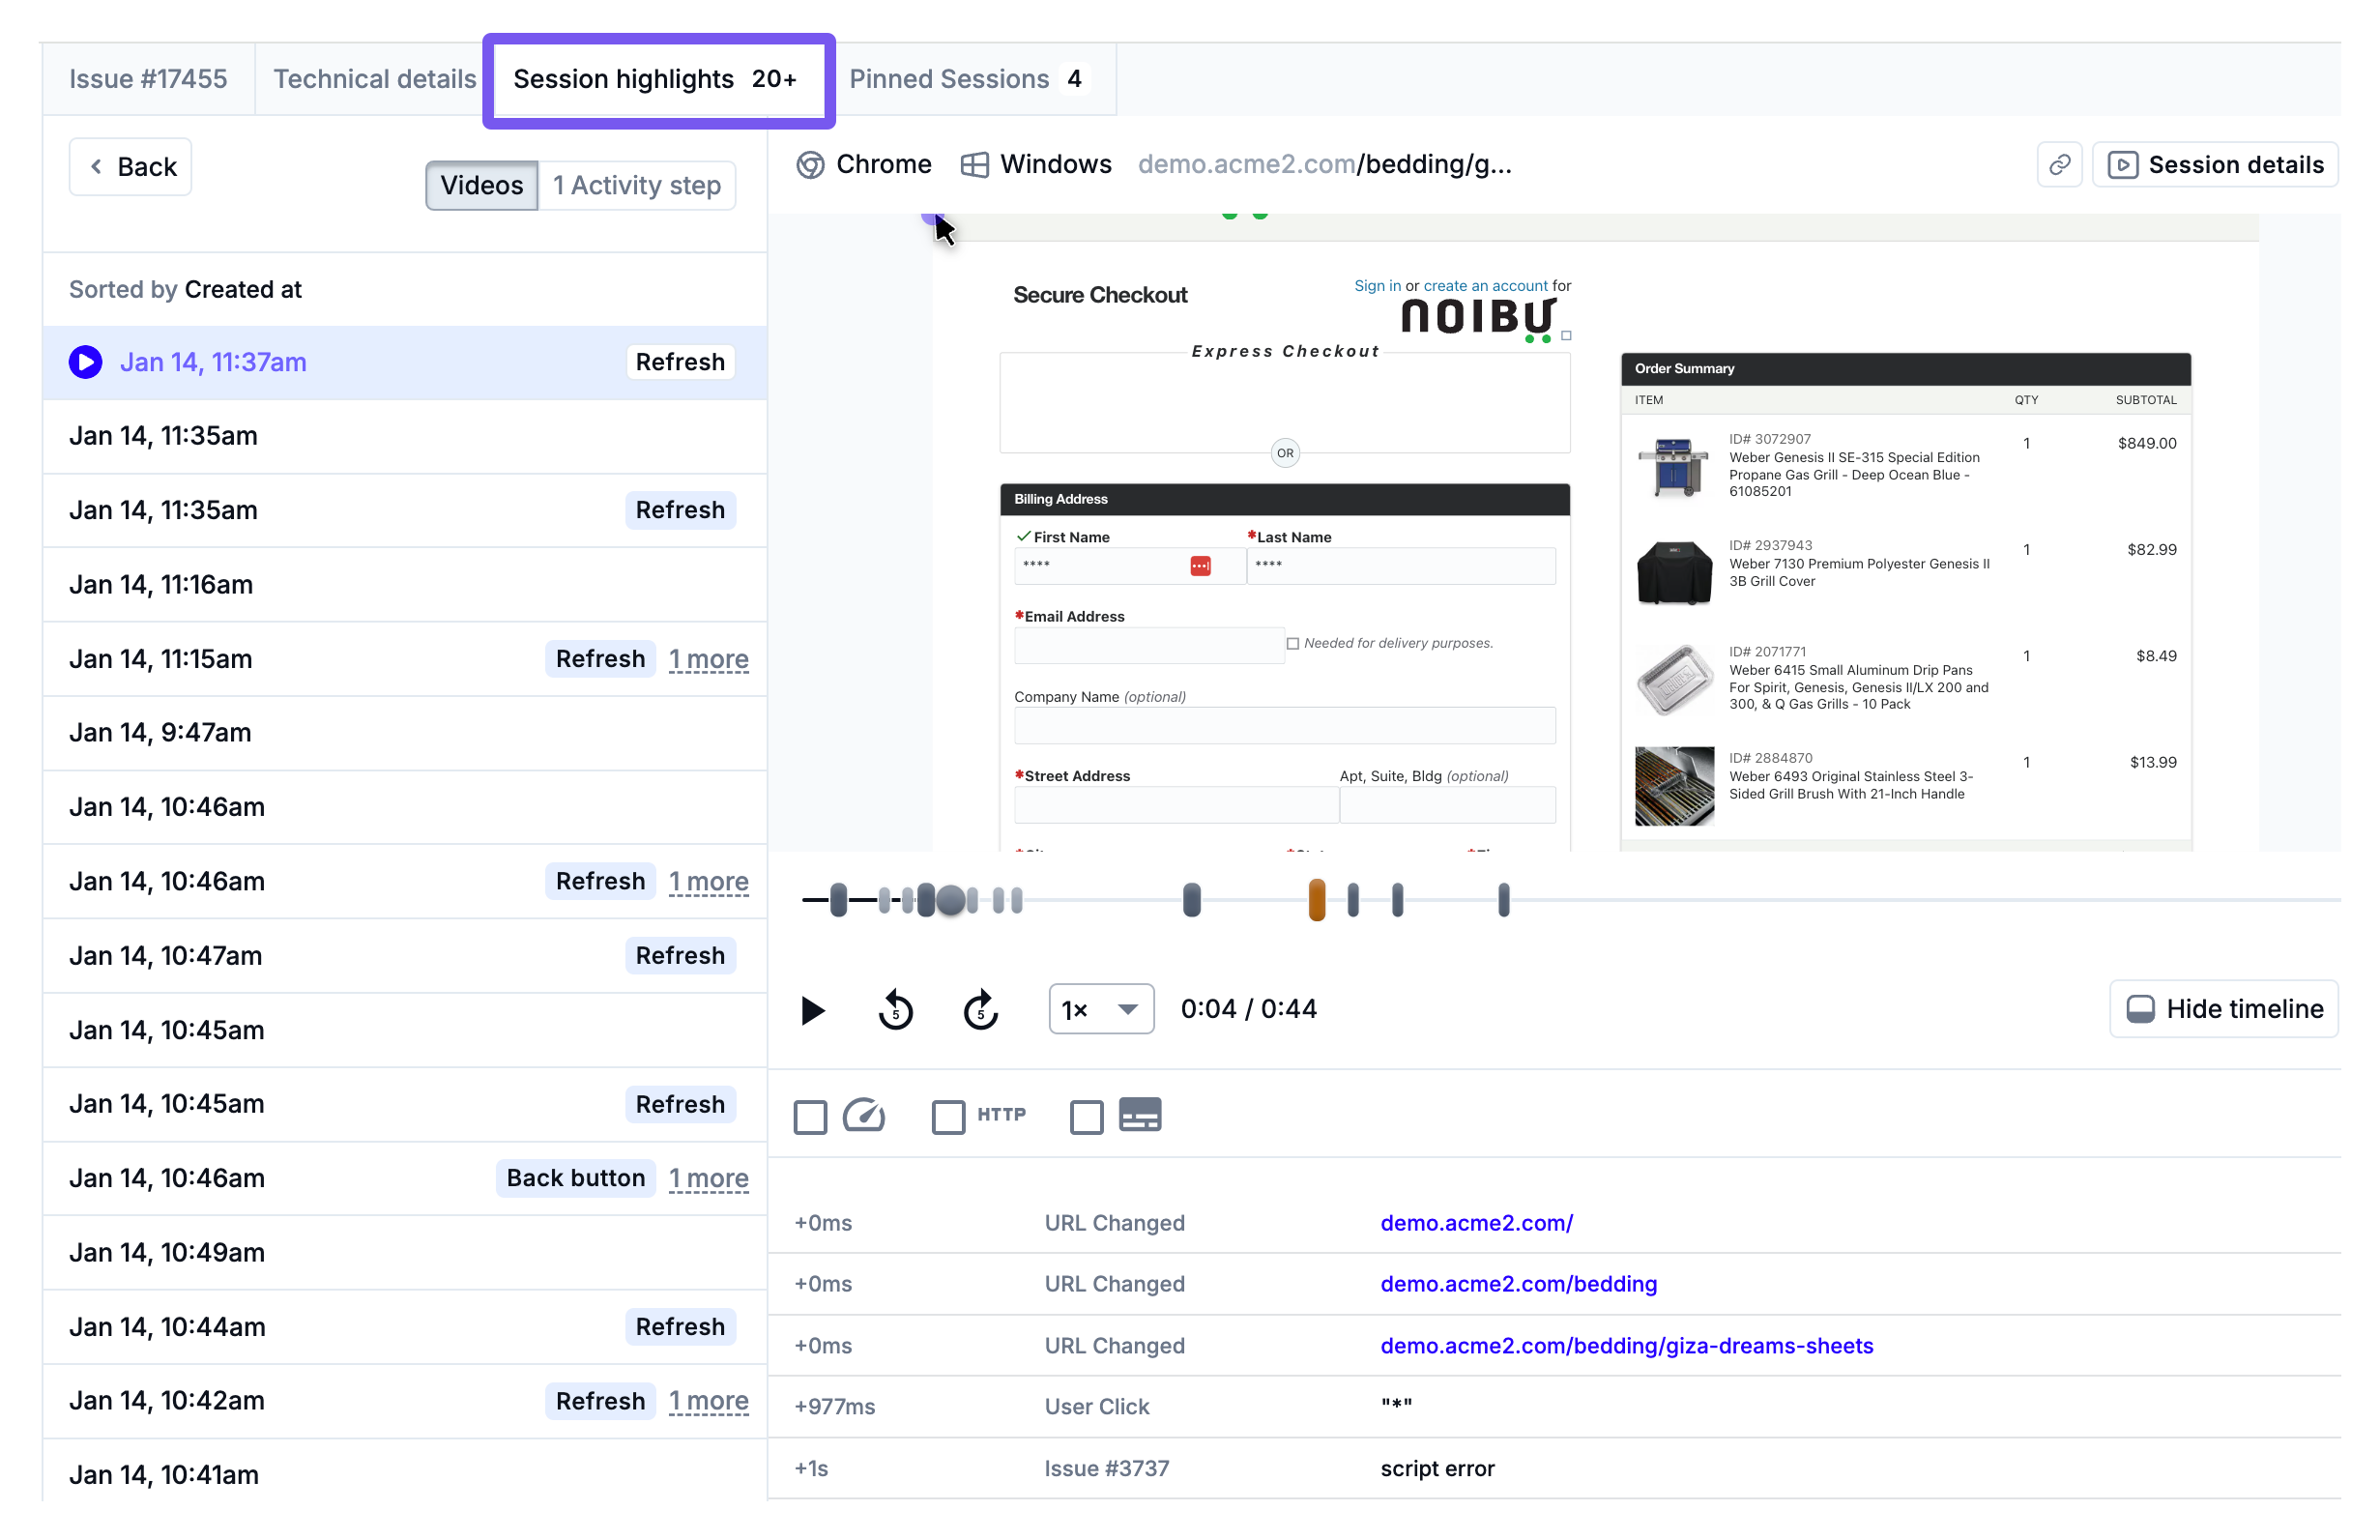
Session Highlights
The Session highlights tab is a powerful tool that collects key moments from session recordings where users encountered the error. By watching session highlights and clicking through the session timeline, you can collect a wealth of insights, including:
What a user sees onscreen when the error occurs.
Each user's browser and operating system, and how this affects how the error manifests.
All HTTP events made, including response times.
We recommend you watch 5-10 session videos to flesh out your error data before moving on to Step 2: Forming Hypotheses.