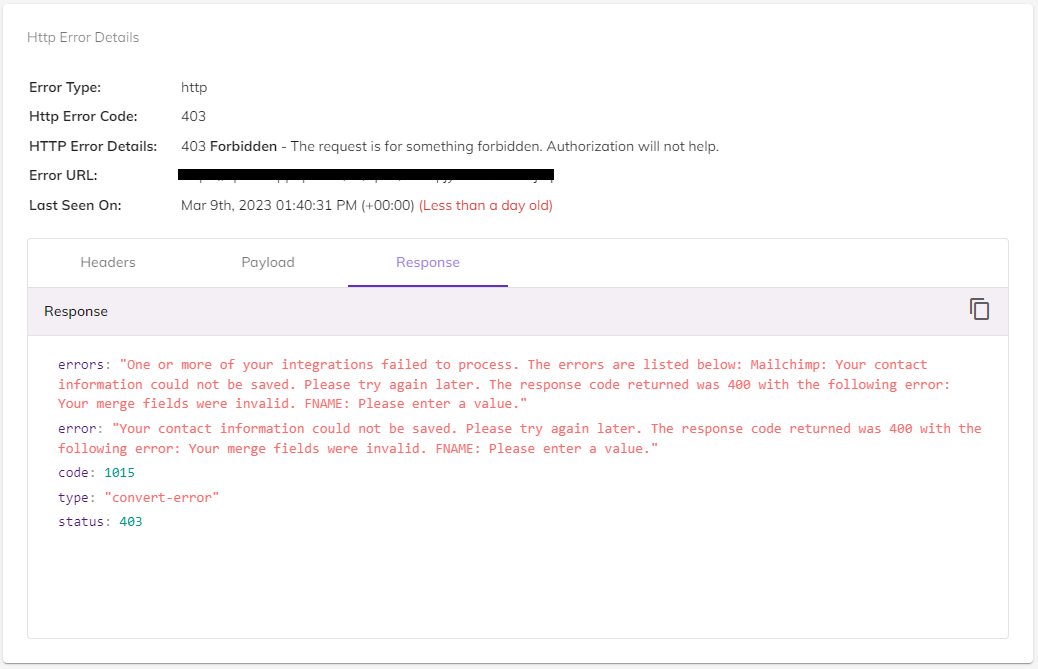
HTTP Error Details
Last updated: March 20, 2026
Just as the Technical Details tab includes a detailed Stacktrace section for JavaScript errors, an Error Details section appears to serve the needs of developers debugging HTTP errors.

The Error Details section lists the error’s type, code, message, URL, and the date on which it last appeared. Below, you'll find tabs to list the issue’s headers, payloads, and responses. These tab includes buttons to copy the headers to the clipboard for easy use.
As most DevOps engineers advise against verbose logging on the origin server, engineers often have little to no visibility of the request or response for an API call when debugging an HTTP error. By capturing the headers, Noibu allows an engineer to build a precise case with customer data without turning on verbose logging, a resource-intensive process.
Having Noibu store payloads and responses eliminates the need for engineers to set up “log traps” to smoke out bad data as the root cause of an issue. This simplifies the workflow, allowing an engineer to access it in one system instead of having to search across a network of hard drives for the same information.
HTTP collection must be enabled on a per-domain basis. Open the Domain module, select a domain, and check the Collect HTTP Data box on the Domain Details page.
When HTTP data collection is enabled, the Error Details section will list the issue's headers by default. However, collecting and displaying payloads and responses requires an additional step of identifying allowed URLs. Learn more about How to Allow or Exclude URLs for Payload & Response Collection.
Learn more about the other sections on the Technical Details tab: Browser & OS Version Impact.