Analyzing error trends on the Logs Page
Last updated: March 19, 2026
The Logs page in Noibu gives you a real-time running list of warning, error, and fatal logs from your ecommerce platform provider over time. Every log ingested is surfaced here, allowing you to identify anomalous spikes in error logs, and review any associated session replays to determine if and how the event impacted a user. Additionally, log grouping allows you to discover clusters of similar log patterns.
Filtering the Logs page
Noibu collects logs with Error, Warning, and Fatal severity levels. You can toggle the different types of logs on or off as needed. Additionally, you can filter logs to specific SFCC session IDs. This allows you to see all logs associated with a specific session.
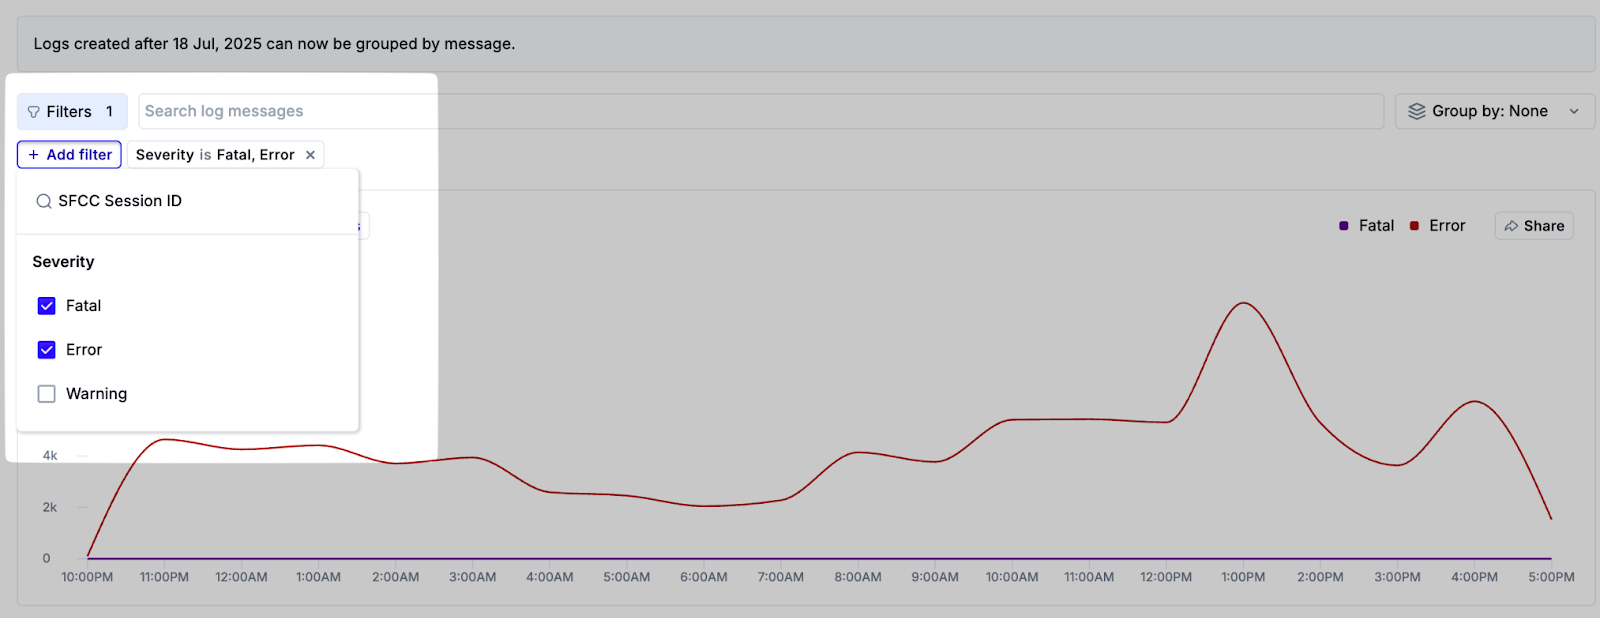
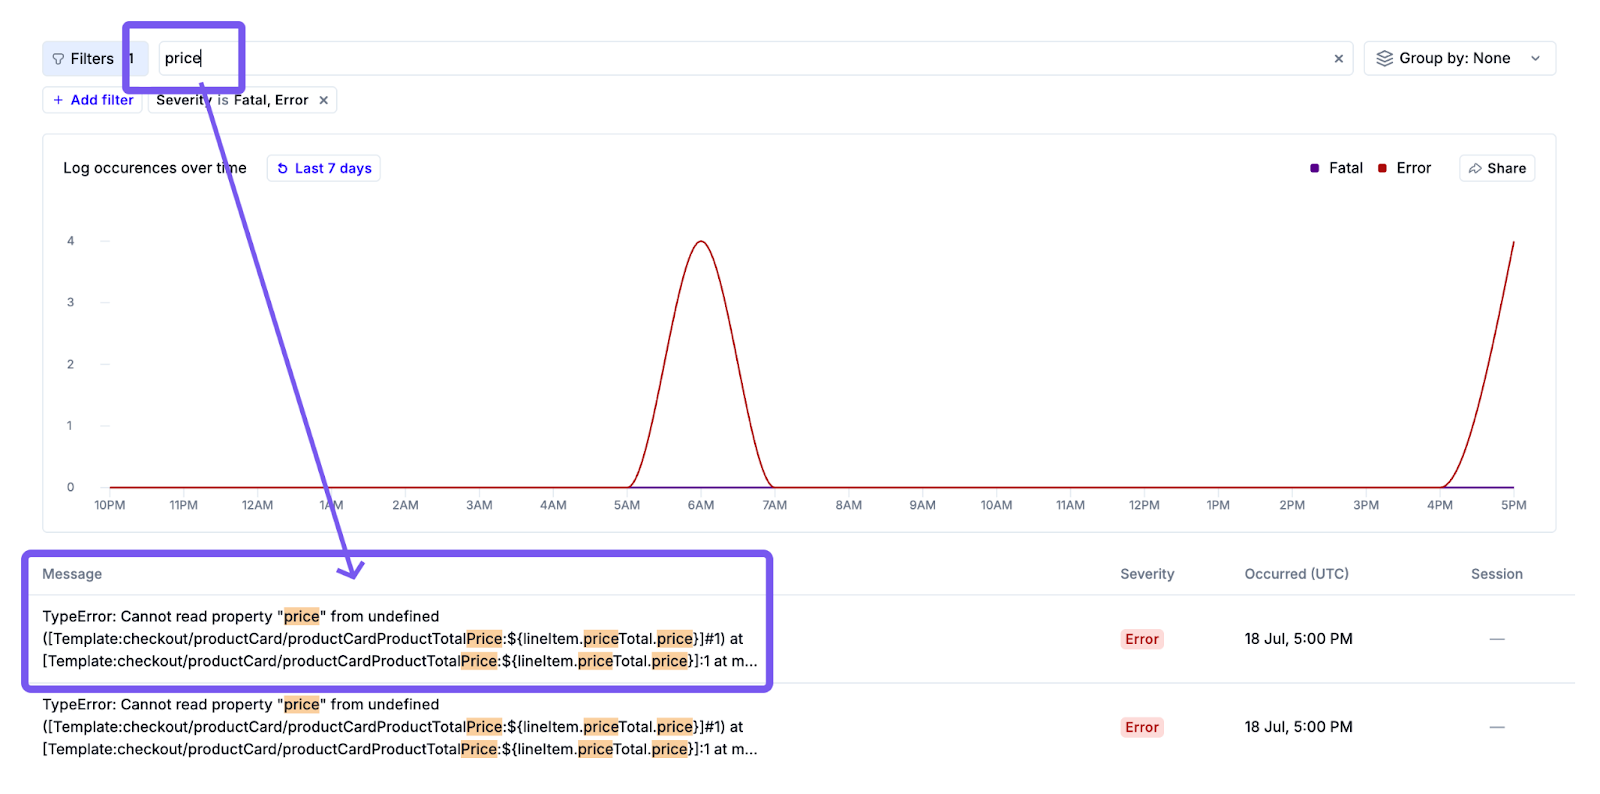
Use the search field to narrow the search for specific logs by looking for text within a log message, using quotation marks to search for an exact term or phrase.
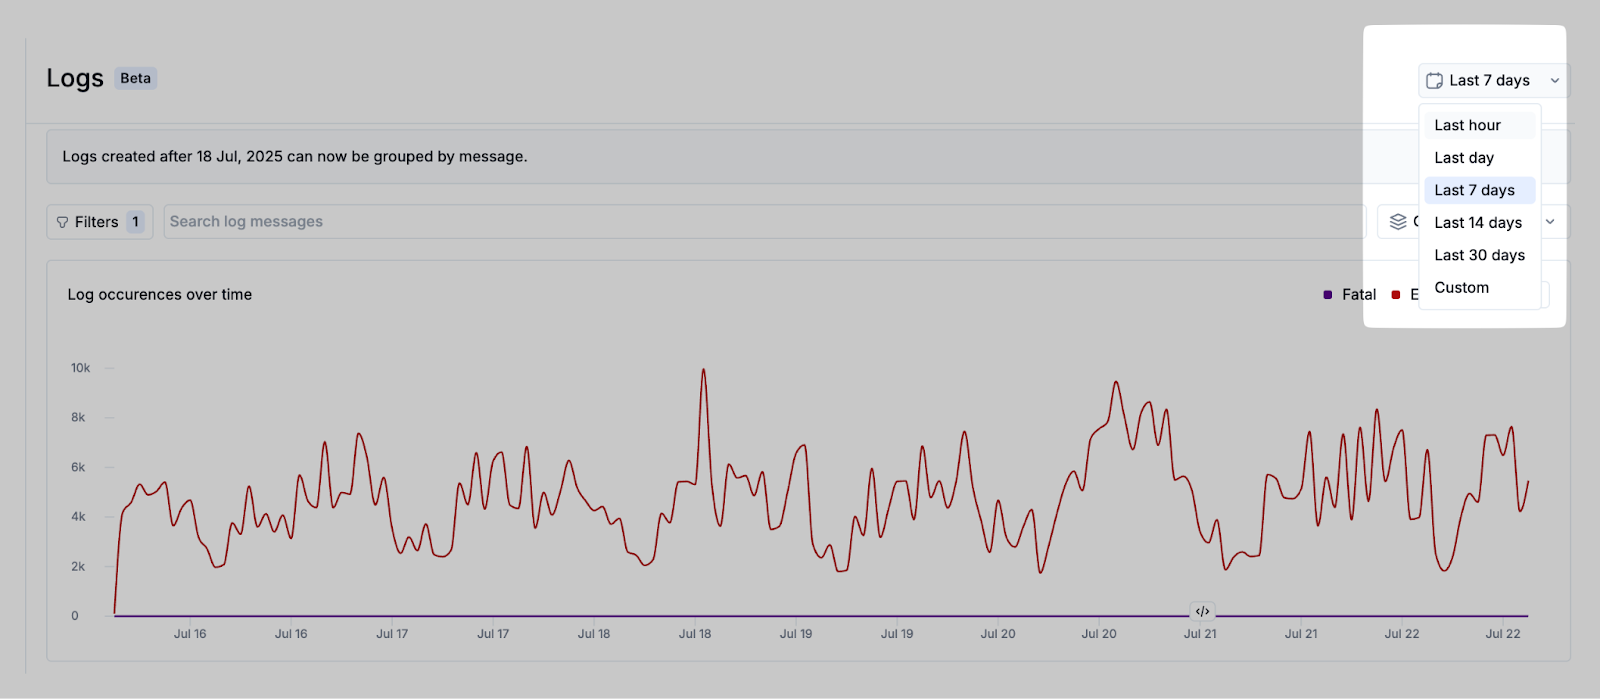
You can adjust the time period under review, from the last hour, day, 7 days, 14 days, 30 days, or a custom range. Choosing Custom will bring up a date picker, allowing you to specify the date and time range.
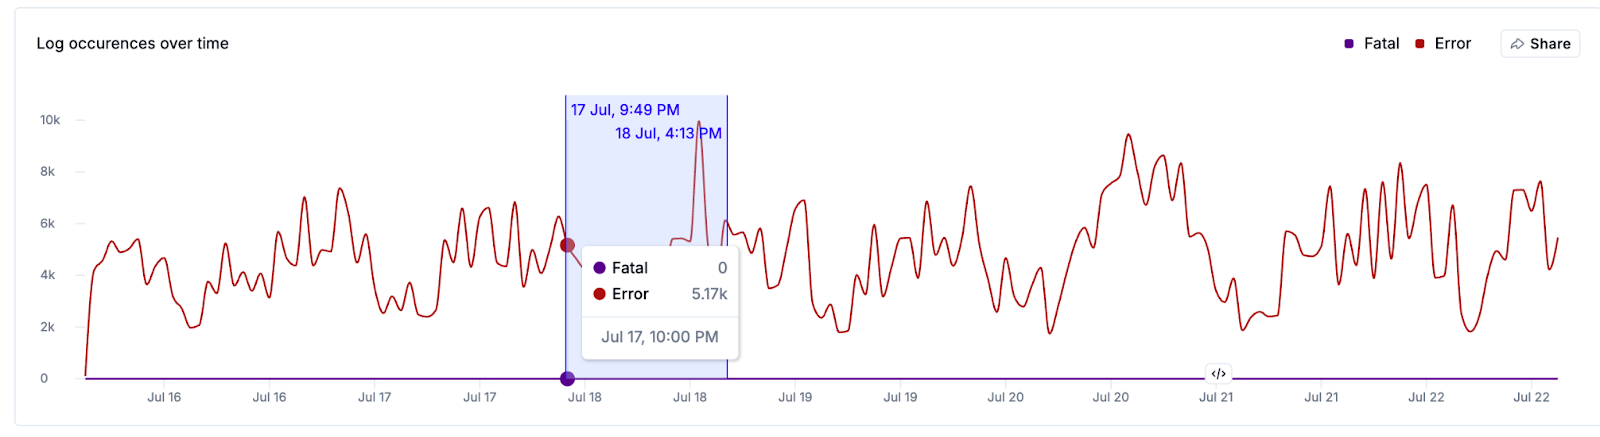
You can also choose a custom date range by clicking and dragging on the Logs chart.
Logs chart and index
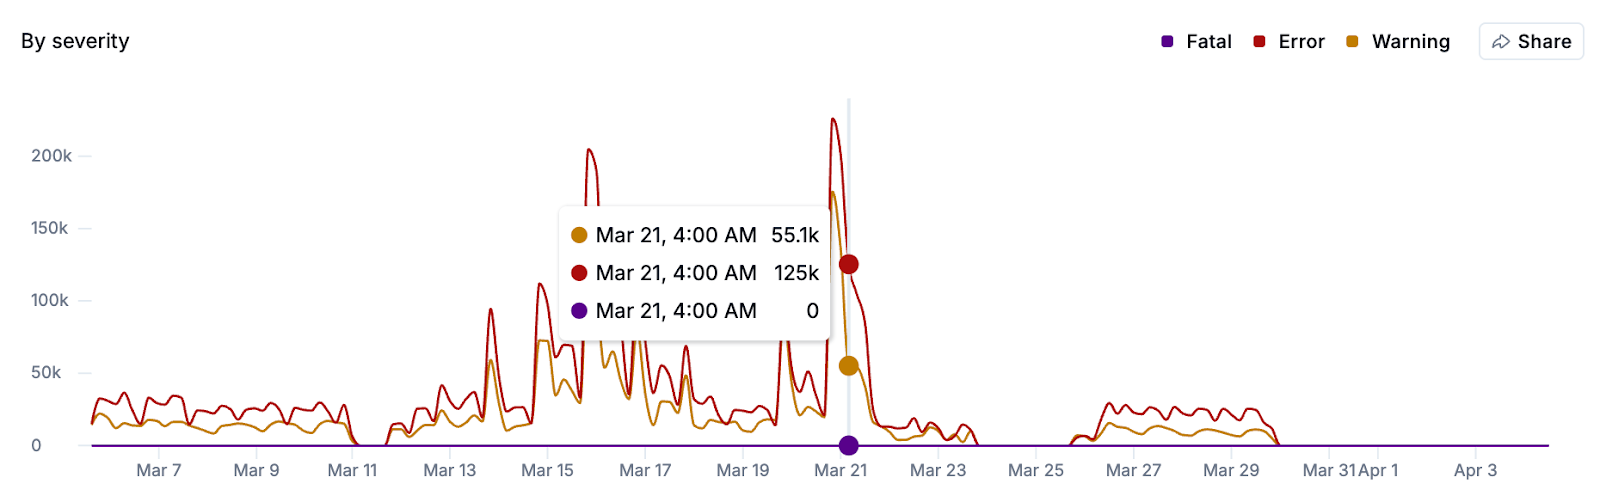
The chart and the data beneath it will refresh automatically as you adjust your search filters. Hovering over a point on the chart will show you how many of each log type occurred at that time.
Click the Share button to copy a link to the Logs page with current filters applied, or to copy the chart to your clipboard. This can be a useful way to loop in other teams for investigation, or to share visual confirmation that a fix has been applied and log event frequency has decreased.
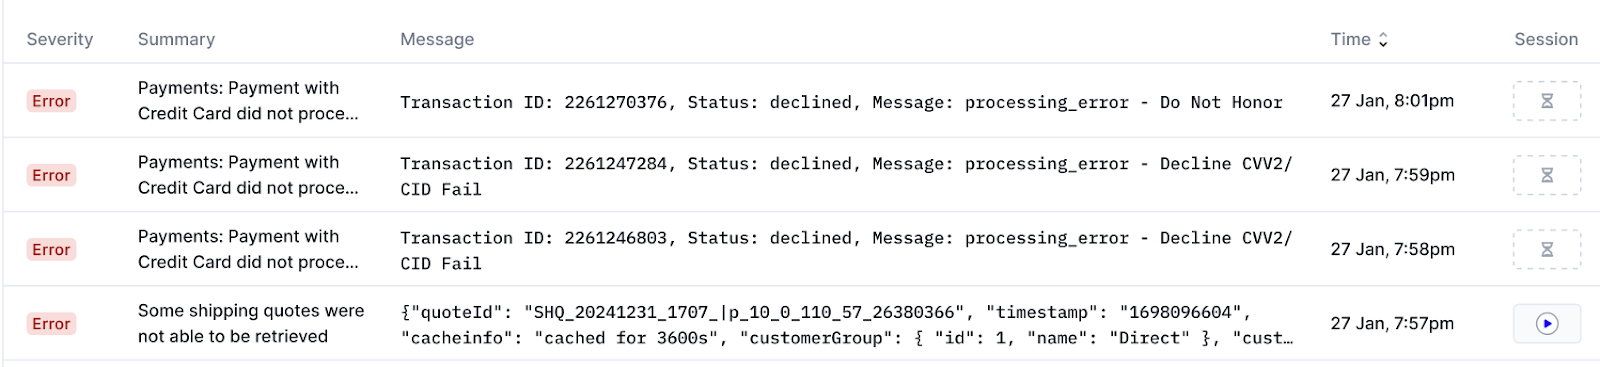
Beneath the chart is a detailed list of logs for the time period selected, presented in reverse chronological order. For each item in this table you will see the severity level (warning, error, or fatal), a preview of the log message, the time the event occurred, and a link to the impacted session replay (if available).
Clicking on any row in this table will bring up a side panel with full details about the log event.
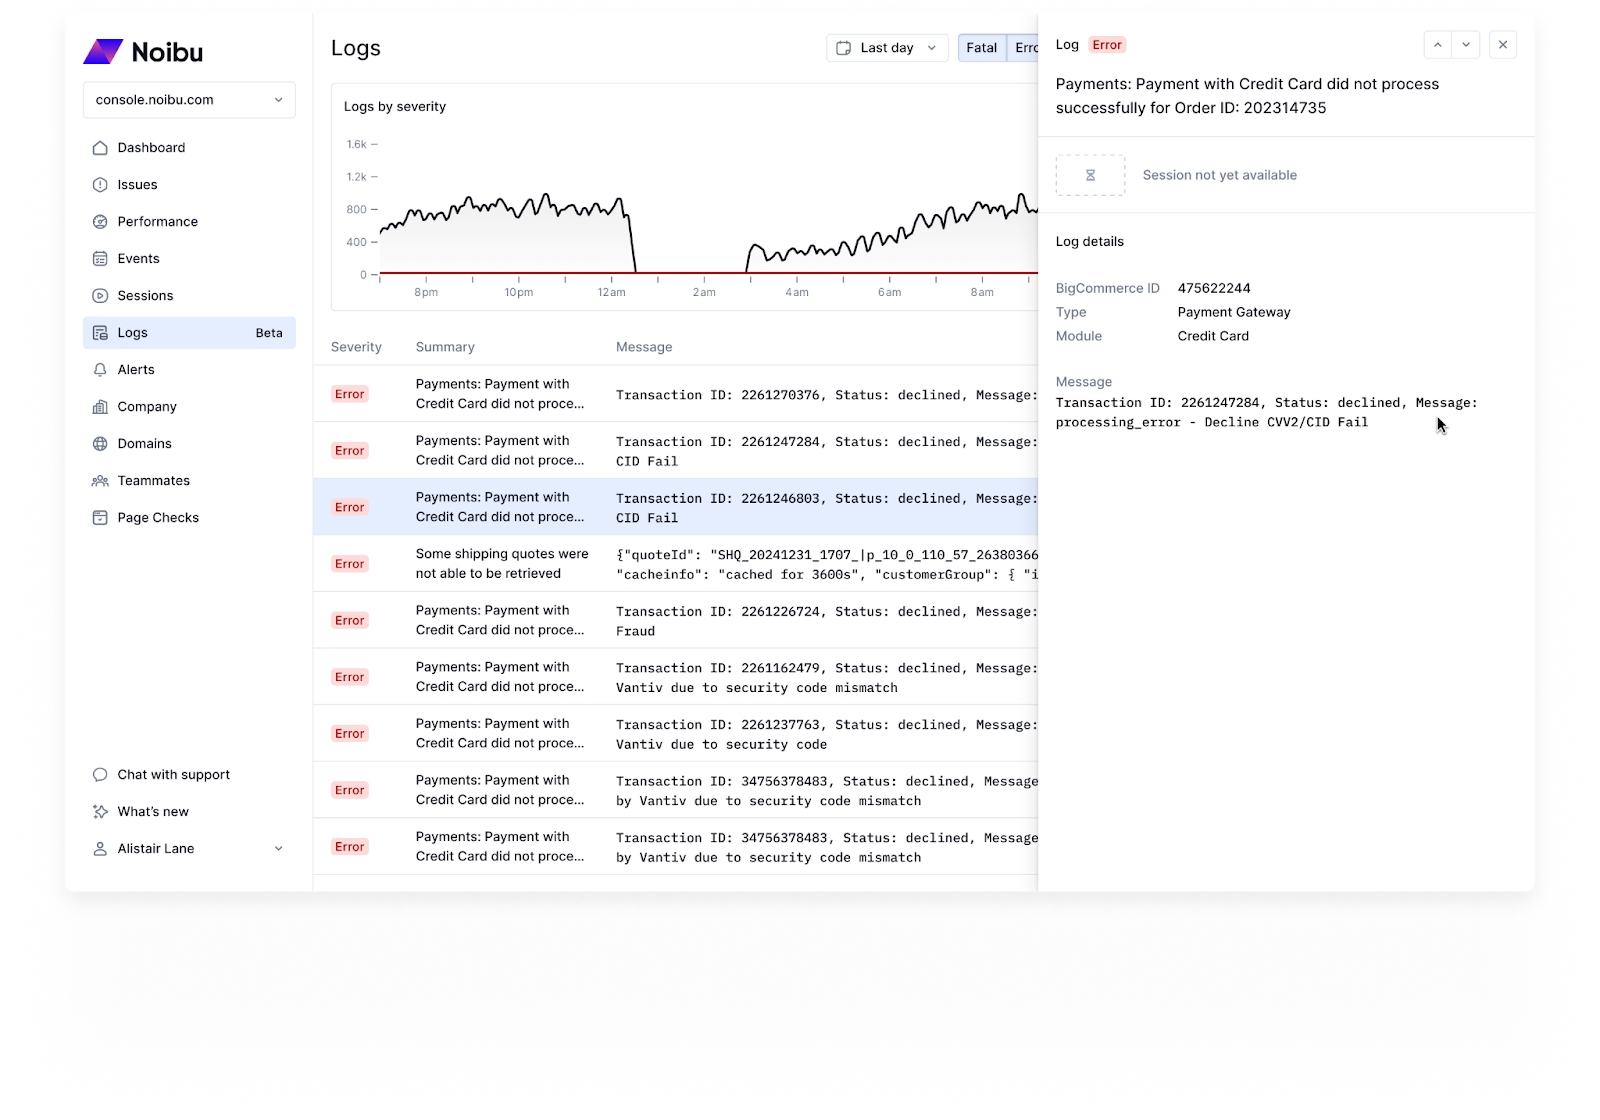
If available, the log details will also include a link to the relevant session replay. However, although logs are ingested in real-time, session replays are not processed until the user’s session has been completed. This means that in many cases, a user’s session will still be active at the time a log appears in the table. Recent logs will display a "session pending" icon until the associated session replay has finished processing.
To specifically find user sessions with associated logs, consider filtering the sessions page instead.
Viewing Log groupings
By default, the chart at the top of the Logs Page displays the volume of individual log entries over time. However, with grouping enabled, this chart will now show trends for the top five log groups—clusters of similar logs with abstracted patterns. To enable grouping, use the Group by dropdown at the top of the page and select Group by: Message.
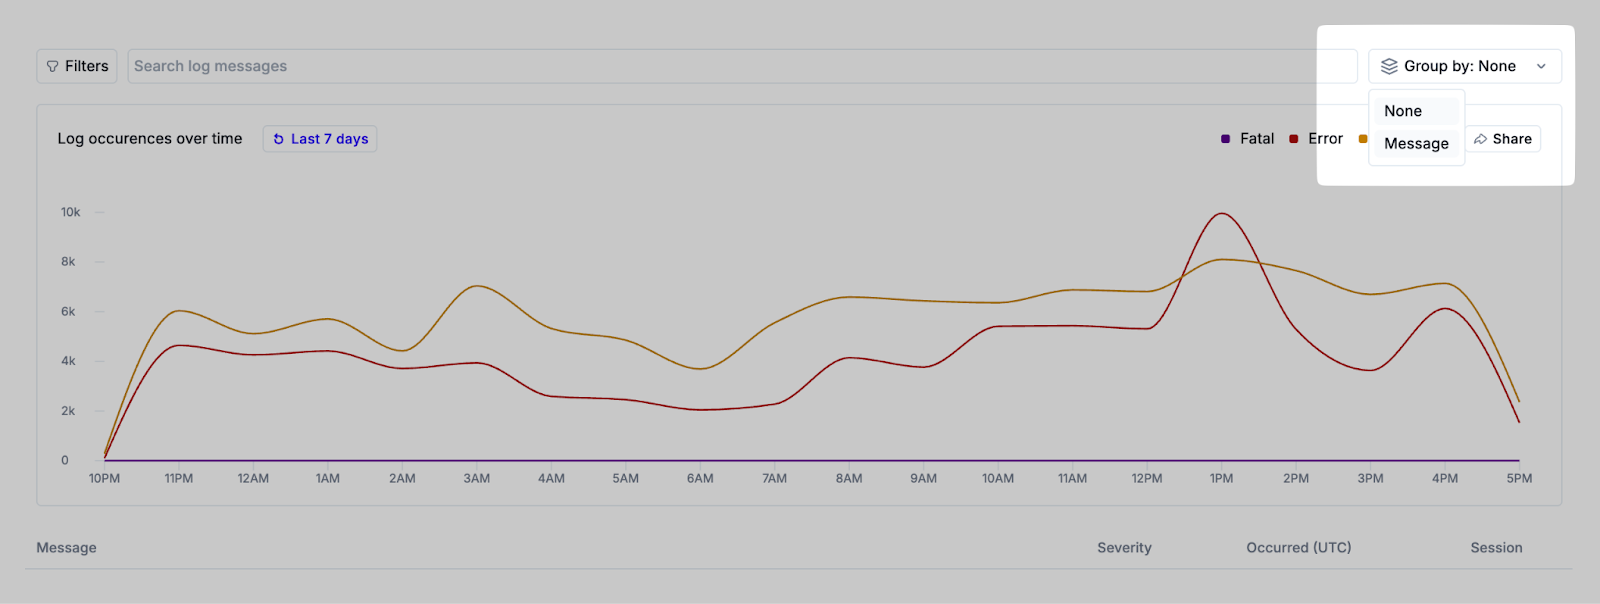
When grouping is enabled, similar log messages are automatically clustered into groups based on shared patterns, using regex-based abstraction of variables such as IDs and URLs. This allows for clearer insight into which issues are occurring most frequently and which may be newly introduced.
Note that due to Noibu’s 30-day retention policy for logs, a group will disappear if no occurrences are seen within a 30-day period but may reappear if the pattern returns in future logs.
When logs are grouped, the table below the chart changes to show the following additional columns:
First seen: Timestamp of the first instance within the selected time range.
Last seen: Timestamp of the most recent occurrence.
Occurrences: Total count of log events within each group.
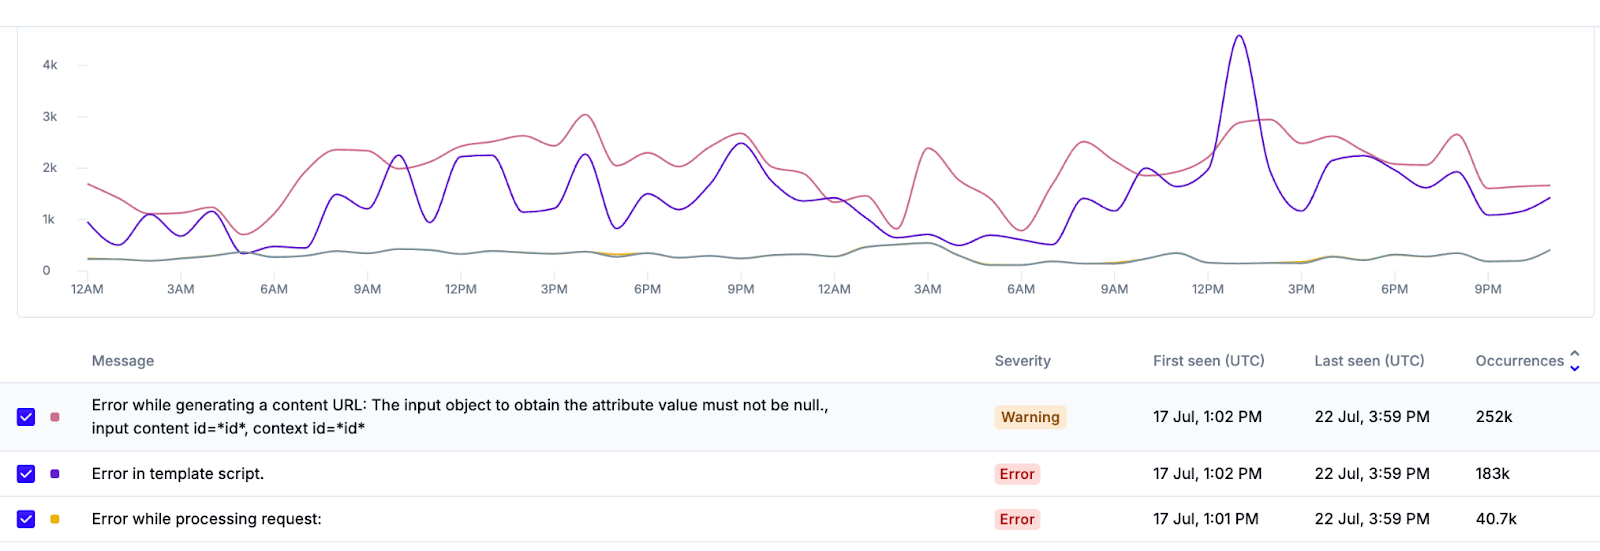
Each log group can be selected using a checkbox to display its trend in the chart above. Up to five groups can be shown simultaneously. This allows teams to monitor specific error patterns, analyze changes between deployments, or confirm whether an issue has been resolved.
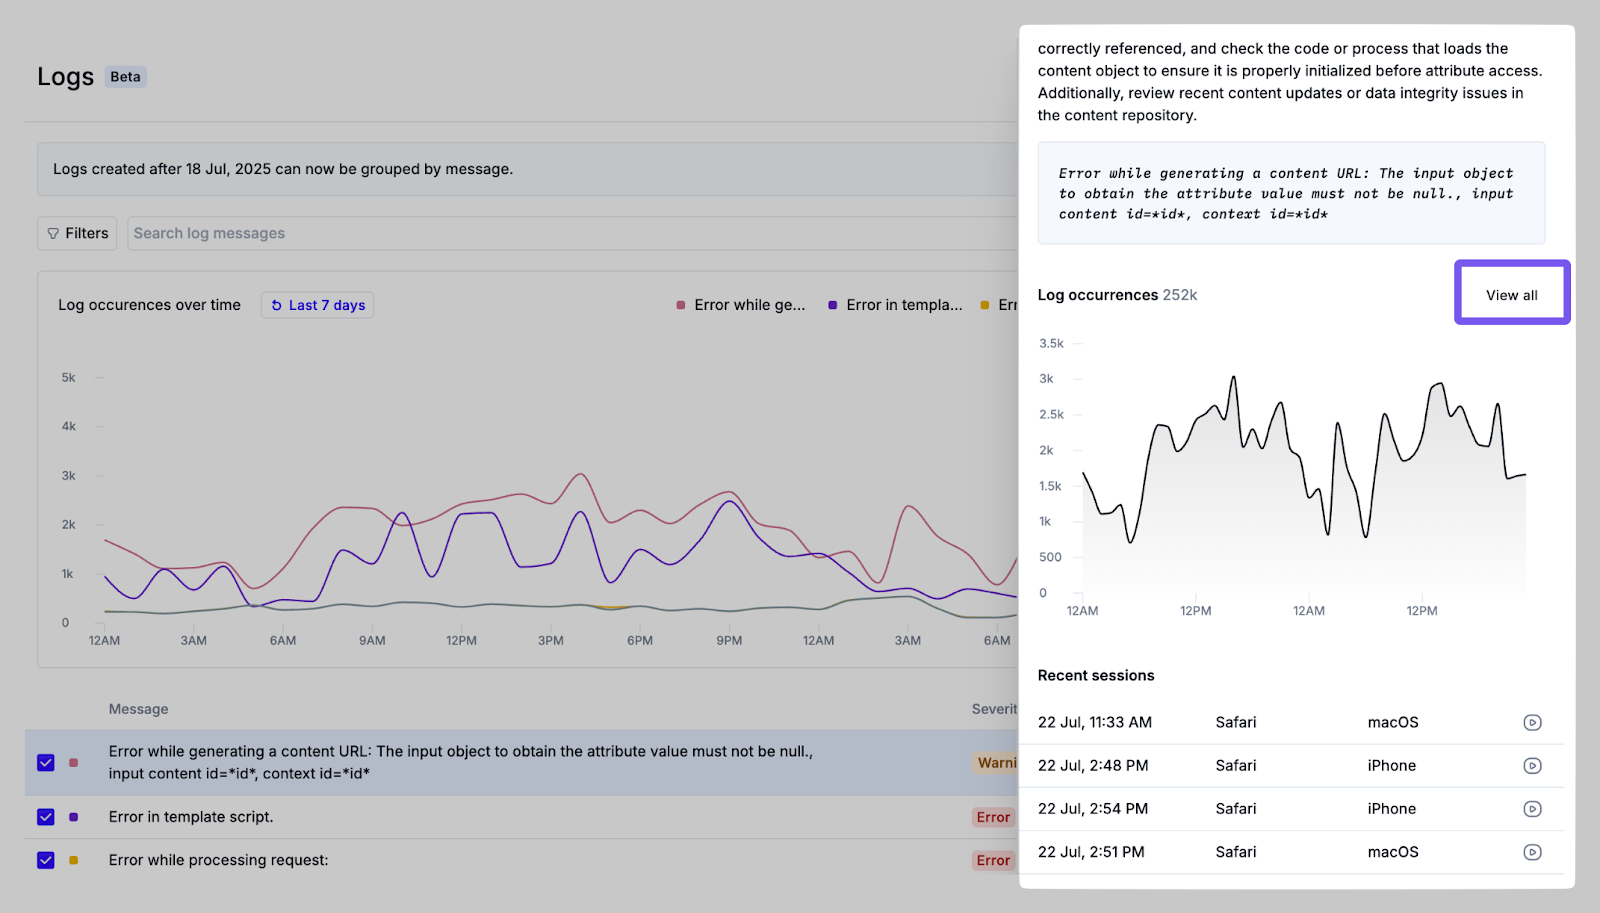
Clicking on a log group row opens a detailed panel. This includes:
An AI-generated description explaining the likely cause or impact of the log message.
The log group pattern, showing the normalized structure of the message.
Total occurrences within the selected period.
A list of associated user sessions, if available.
Clicking the View All button beside the Log Occurrences chart takes you to a detail page for the log message group, which allows you to inspect individual log events in more detail.
Log Message Group Details
The Log Message Group page allows you to analyze logs in more depth. Log grouping helps engineering teams quickly identify frequent, newly emerging, or abnormal log patterns and drastically reduces the time required to triage and prioritize error investigation. You can get to the Log Message Groups page from the logs index or an individual session replay with logs.
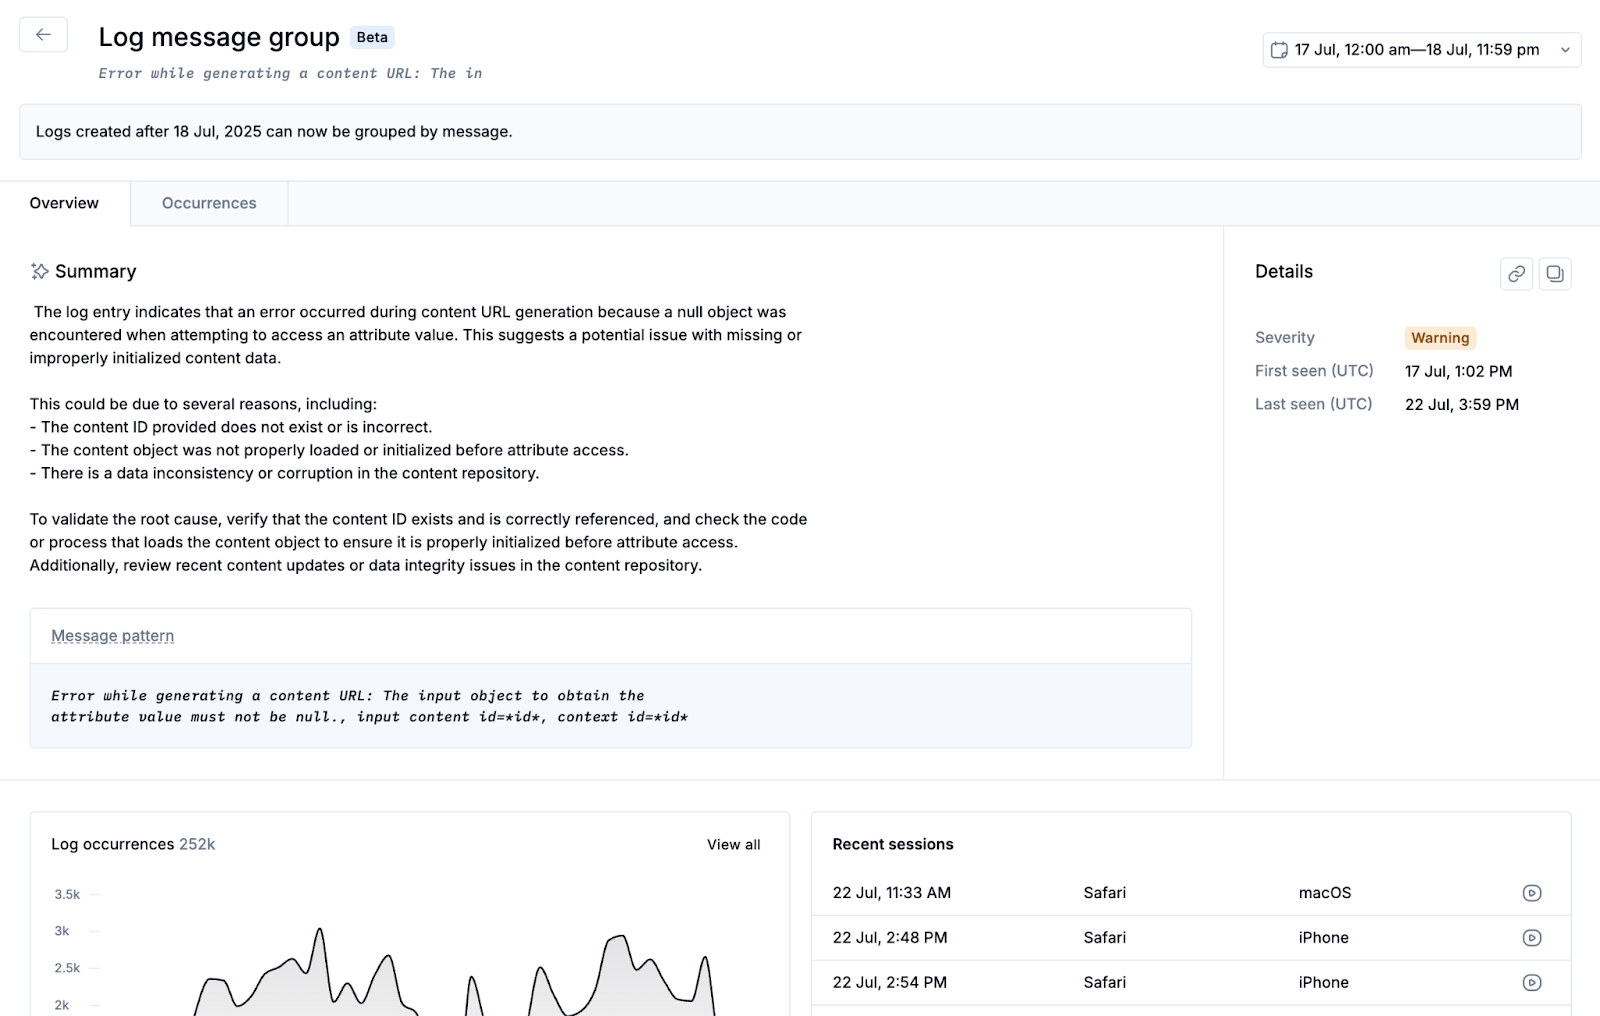
For a given log message group, the Overview tab of this page shows:
An AI-generated summary describing the possible cause or impact of the related error
The “message pattern” with a simplified, normalized structure of the related log messages that excludes dynamic elements like IDs or timestamps.
Total occurrences over time within the selected period
A list of associated recent user sessions
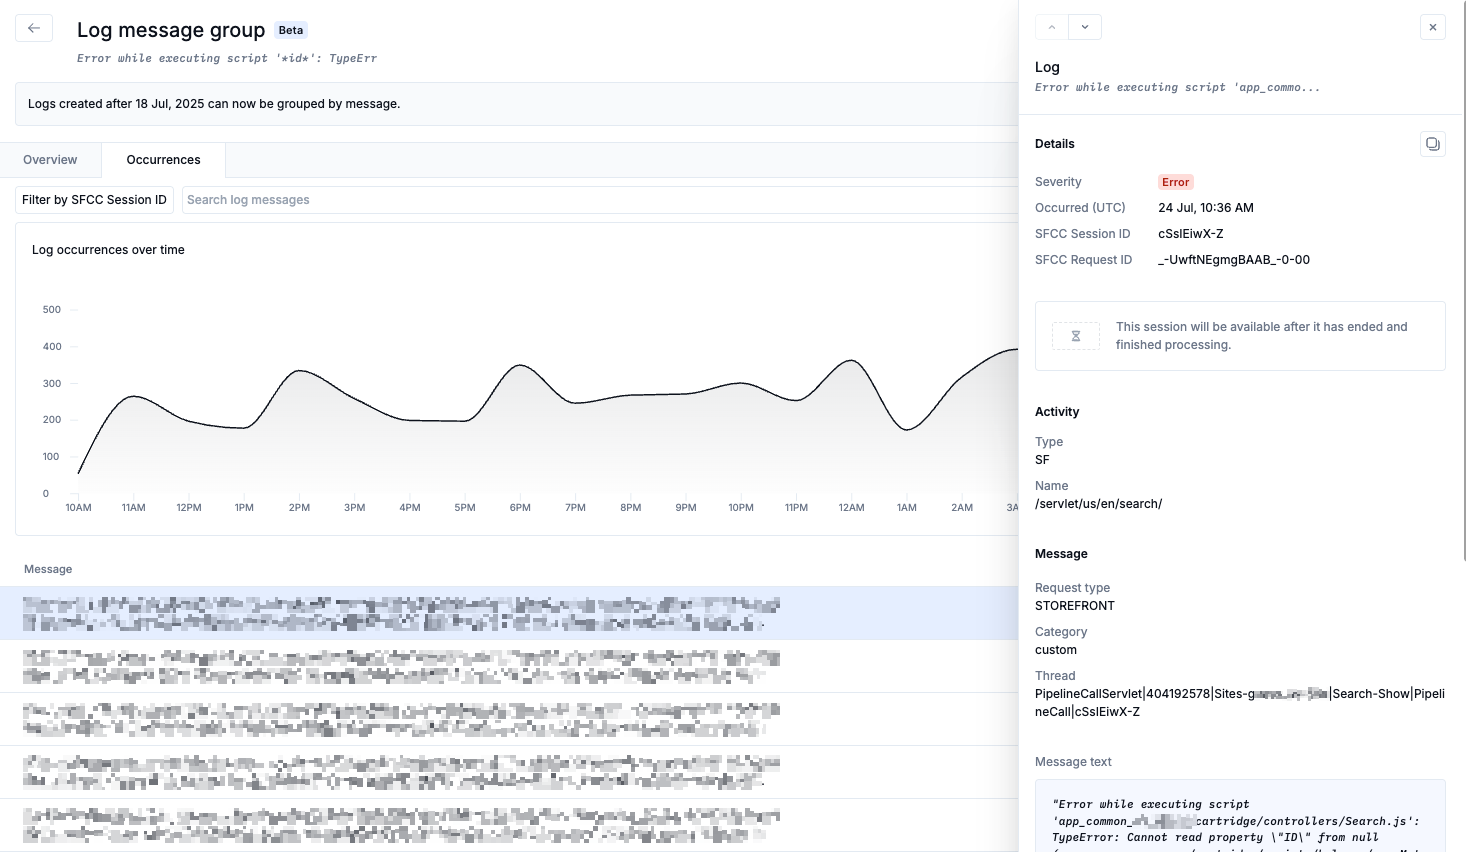
The Occurrences tab gives a more detailed view of the log activity over time. You can adjust the time range using the time selector or by clicking and dragging on the chart. The table beneath displays all log entries that match the group pattern within the selected period. Clicking on any of these individual entries opens a side panel with full log details.
To facilitate collaboration between teams, the following sharing options are available:
Copy a link to the log group page, including all filters.
Copy the log group summary to your clipboard, suitable for use in bug reports or triage tools.
Download or copy the trend chart image showing the group’s occurrences over time.