Logs Integration Overview
Last updated: March 19, 2026
Investigating and debugging ecommerce errors often requires technical teams to switch between client-side and server-side tools to connect the dots. Noibu’s Logs Integration bridges this gap by integrating server-side logs for errors, warnings, and fatal events from your ecommerce platform into session replays. Additional filtering and search capabilities in Noibu make it easy for teams to discover trends and analyze log details. This enables a single, streamlined workflow to resolve customer-impacting errors.
Configuring Logs Integration
At this time, Logs Integration is only available for the Salesforce Commerce Cloud (SFCC) clients using the SG or SFRA architecture. To configure the SFCC logs integration, you must (1) request access through your Noibu CSM; (2) pass the SFCC Session ID as a custom attribute to Noibu, and (3) enable log streaming within SFCC.
Learn more about enabling the SFCC logs integration.
Analyzing Log Trends
The Logs page in Noibu gives you a real-time running list of warning, error, and fatal logs from your ecommerce platform provider over a period of time. It allows you to identify anomalous spikes in error logs, patterns in groups of error logs, and any associated session replays to determine if and how a backend failure impacted a user.
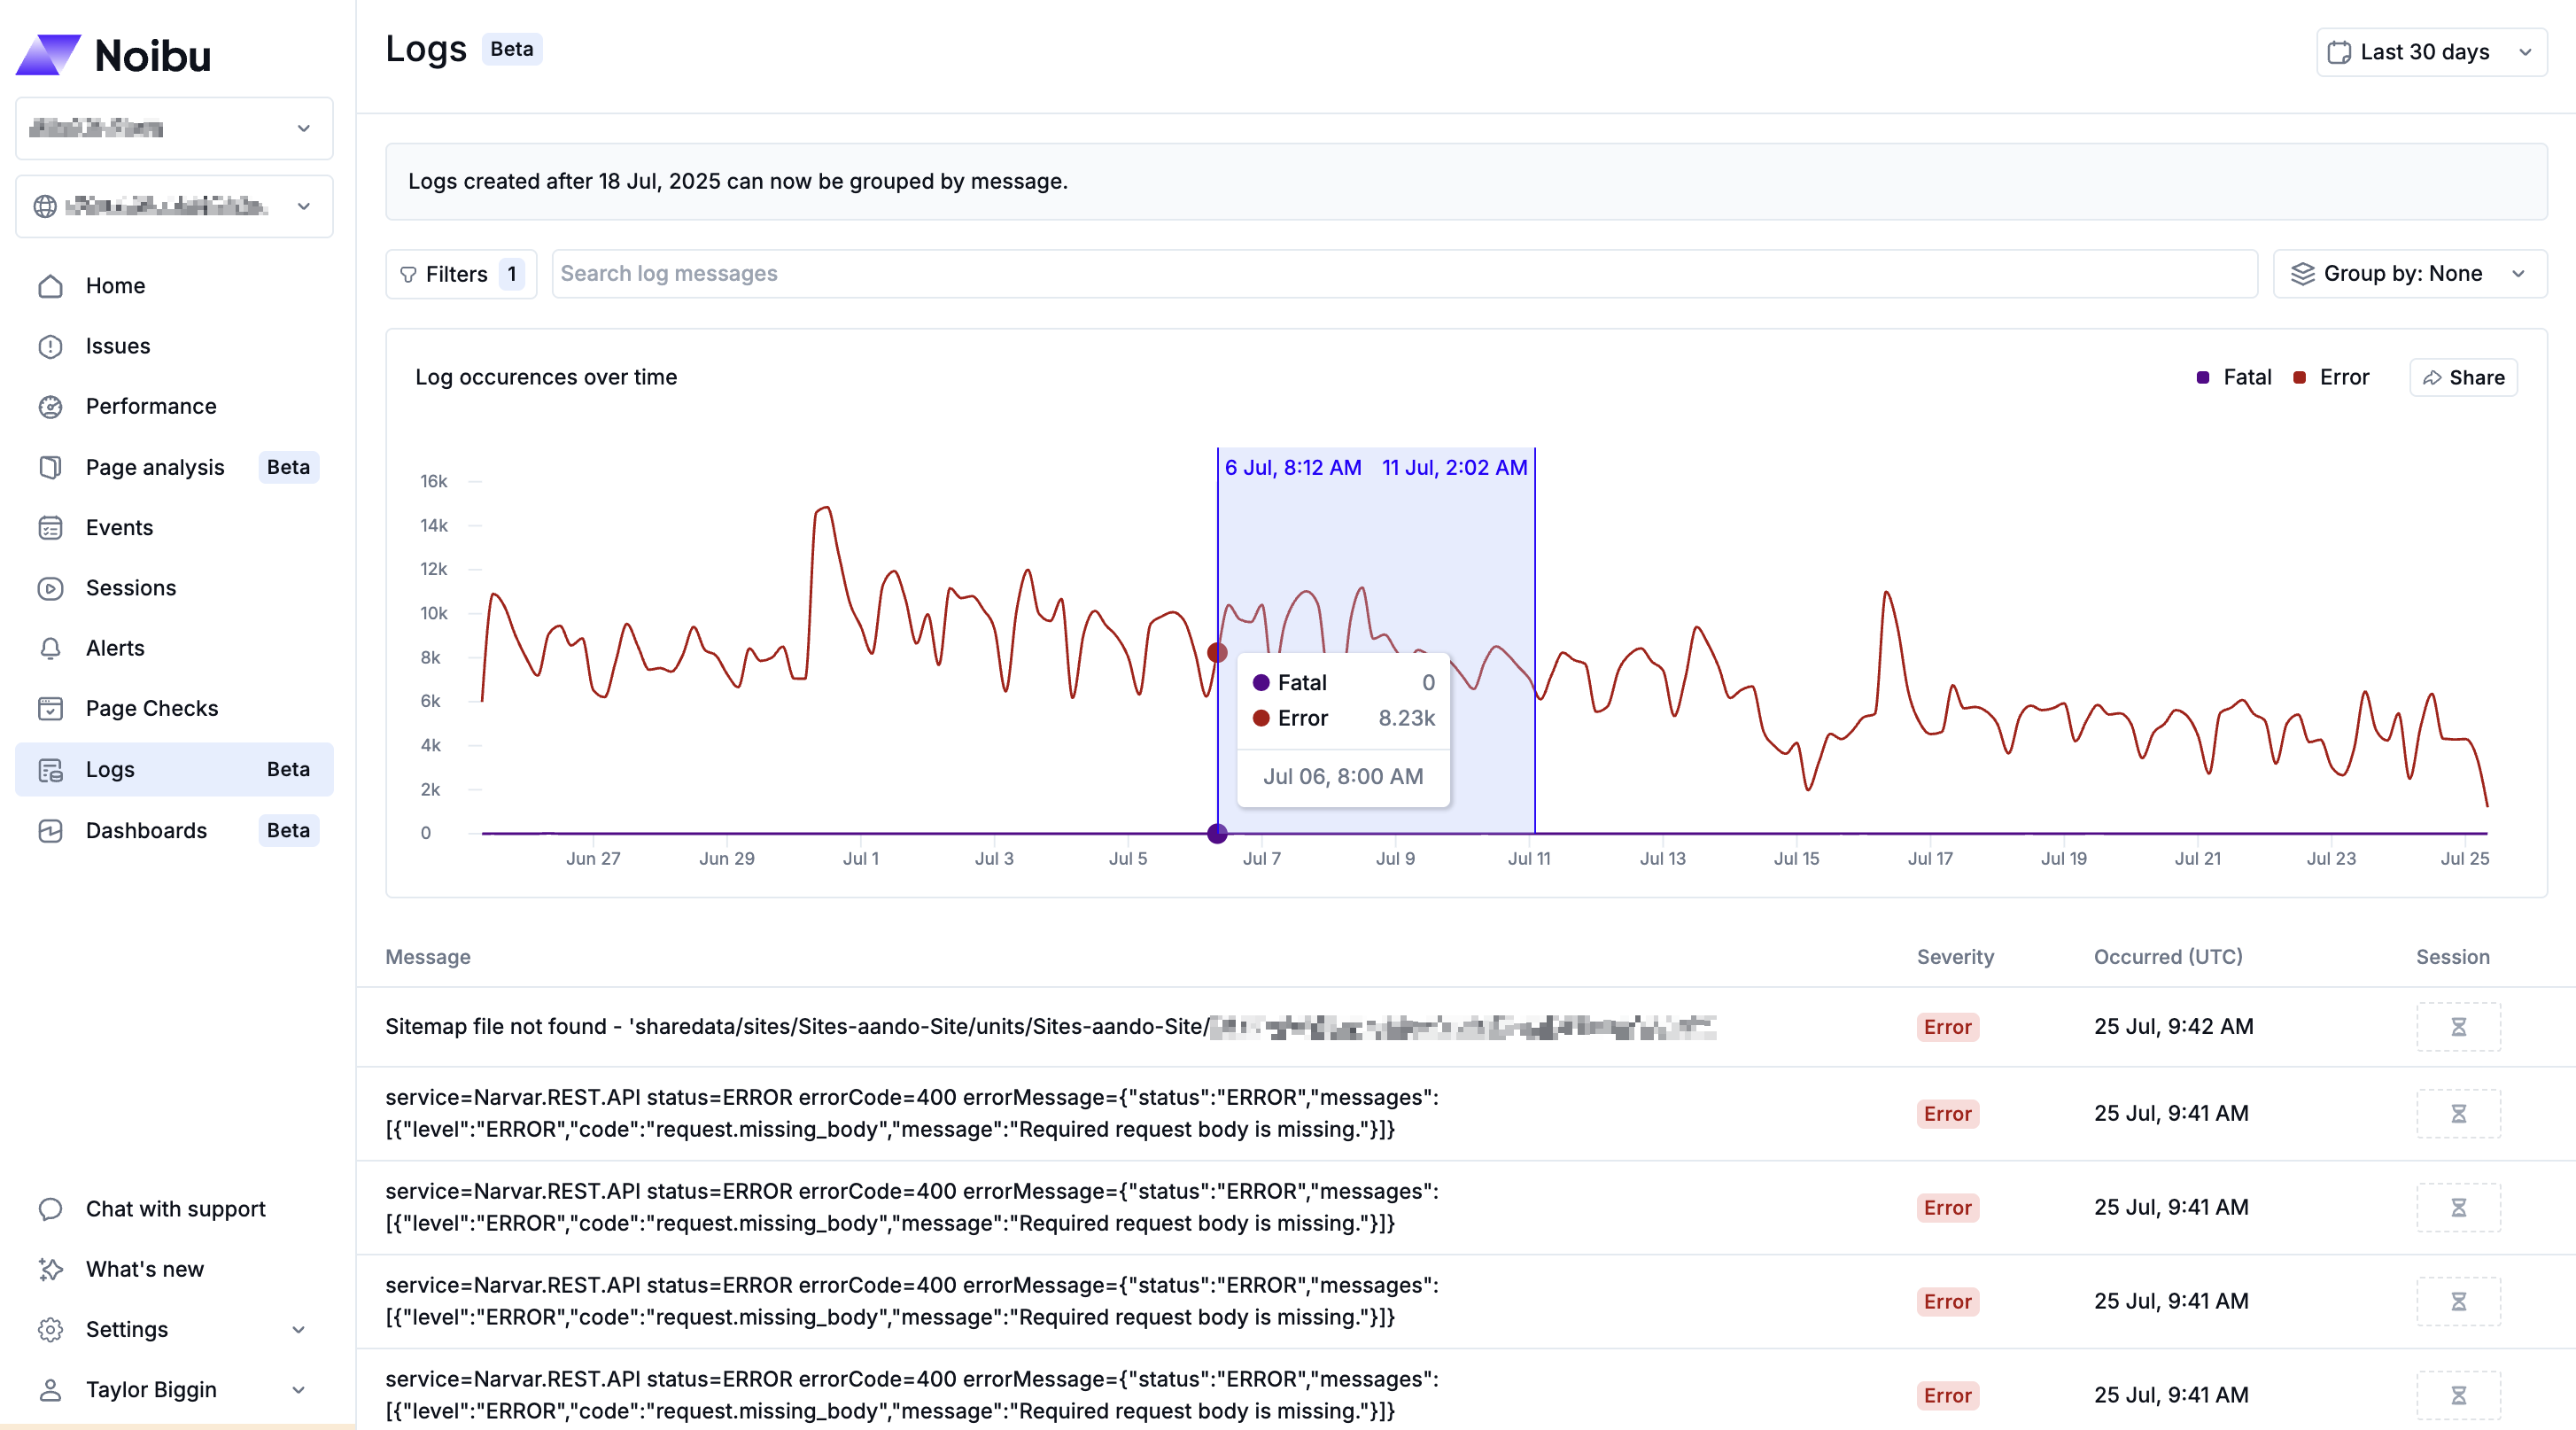
Additionally, Noibu automatically clusters similar log messages into groups based on shared patterns, allowing for faster insight and investigation. Learn more about analyzing log trends.
Viewing Session Replays with Log Data
Noibu links back-end logs data from your ecommerce platform to session replays. This provides a comprehensive view of how server-side errors manifest as client-side experience, shedding light on how to debug and resolve an issue that impacted customers. During playback of a session replay, any relevant error, warning, or fatal log events will be displayed in the session timeline.

You can filter to find sessions with specific log types (error, warning, or fatal) in combination with other filters (e.g. browser type, OS, or URL) to find and review user sessions linked to server-side problems. Learn more about viewing log messages within session replays.