Loading Speed (LCP) Details
Last updated: March 31, 2026
Largest contentful paint (LCP) is a Core Web Vital that measures your website’s loading speed by tracking by the time taken to render the largest visible content element (e.g. image) on a page before a user is able to interact with it.
Loading Speed Over Time chart
This chart provides a visual representation of trends in the relevant Core Web Vital over the time period selected. It plots overall loading speed (LCP) day by day for the time period chosen. Noibu provides historical reporting on this web vital for up to the past 180 days.
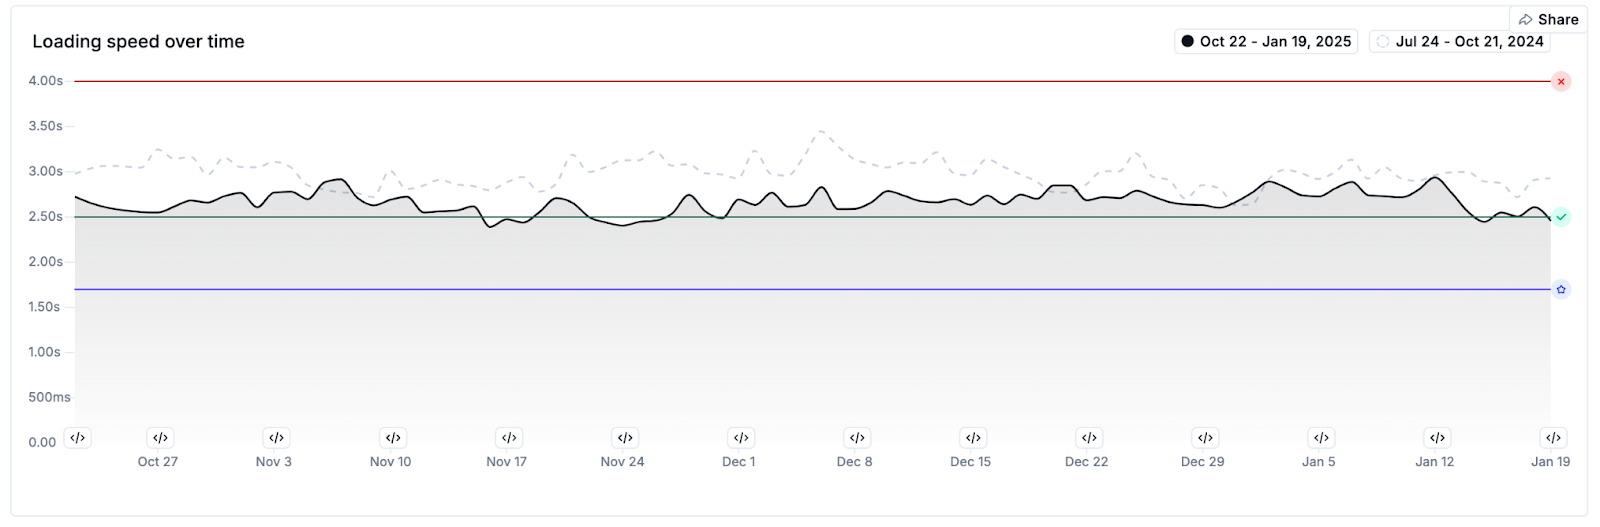
This chart can be interpreted as follows:
The solid black line on this chart indicates your Core Web Vital measurement.
The dotted grey line indicates the measurement over the prior measurement period (i.e. compared to 7, 14, 30, or 90 days ago). Comparing this line to the solid black line shows how performance has changed over time.
The red line on this chart indicates the threshold above which the Core Web Vital would be considered “Poor”.
The green line on this chart indicates the threshold below which the Core Web Vital would be considered “Good”.
The purple line on this chart indicates the “Best on Noibu” benchmark. Learn more about this benchmark.
Core Web Vitals that measure between the red and green lines are considered “Needs Improvement”.
Hovering over a point in the chart displays a tooltip with the measurement at a specific date, as well as the prior period’s measurement.
The “Share” button at the top-right of this chart allows you to copy a link to this page with current filters applied, or copy the chart to your clipboard as a PNG.
If enabled, release events will be indicated along the horizontal axis of this chart via a icon. Clicking the icon will show you a preview of release events that occurred on that date. Learn more about enabling release events.
Top Opportunities
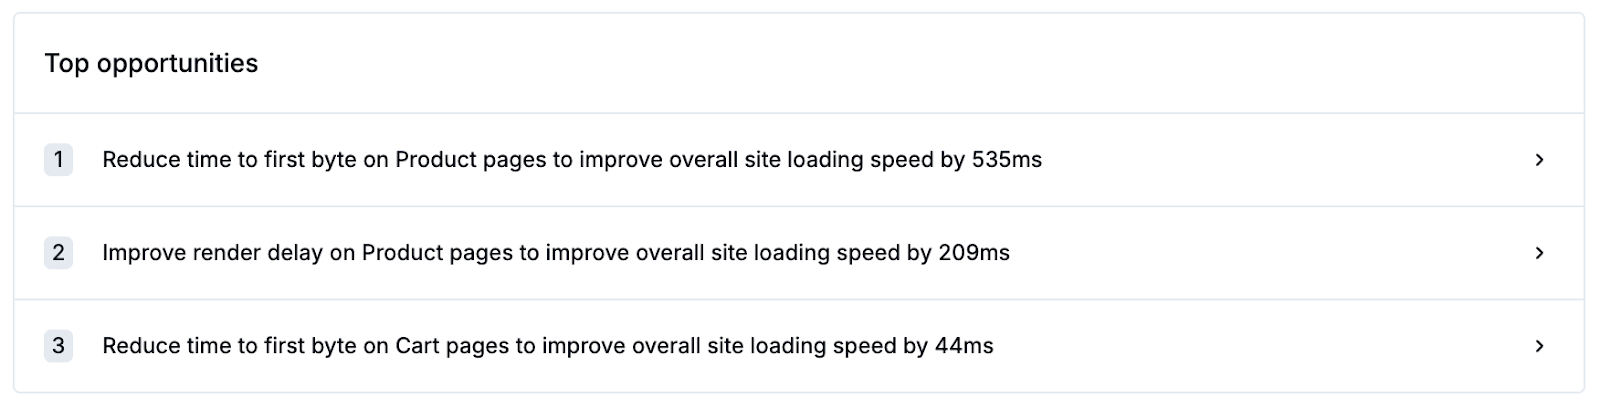
Noibu presents top opportunities for improving loading speed on your site. Clicking on any listed opportunity will provide more detail. Note, you must have page groups configured for Top Opportunities to be presented.
For each listed opportunity, Noibu breaks down the total loading speed measurement into its constituent metrics—time to first byte (TTFB), load delay, load duration, and render delay—to help you understand the root cause of the LCP score.
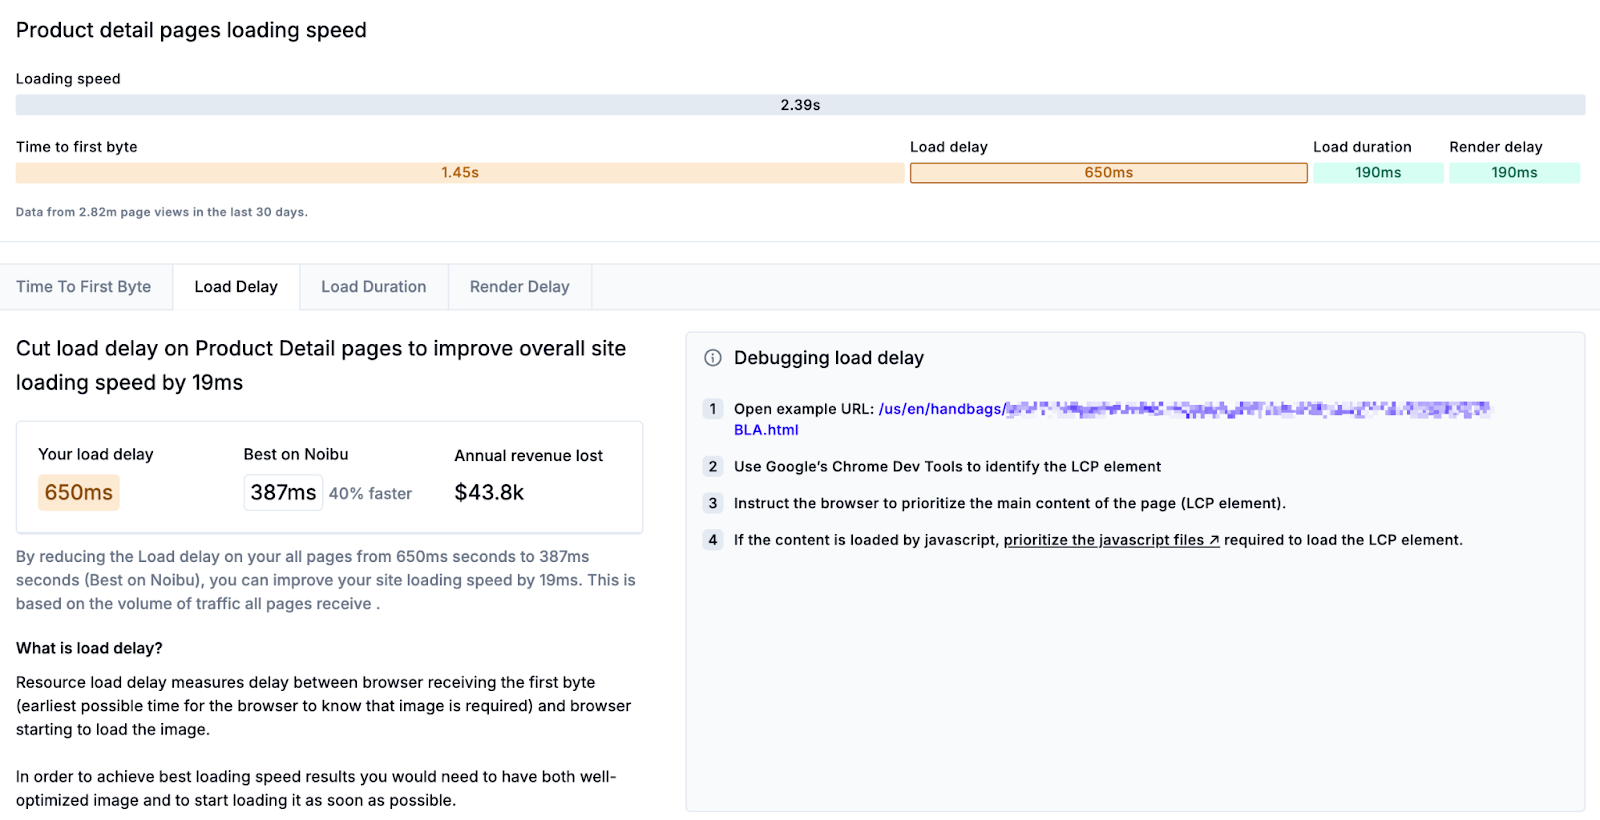
For each of these four metrics, Noibu provides a brief description of what it is, your current score compared to a best-in-class benchmark, and links to relevant resources to help technical teams diagnose and resolve the problem. Learn more about diagnosing and resolving LCP performance problems.
Revenue Lost
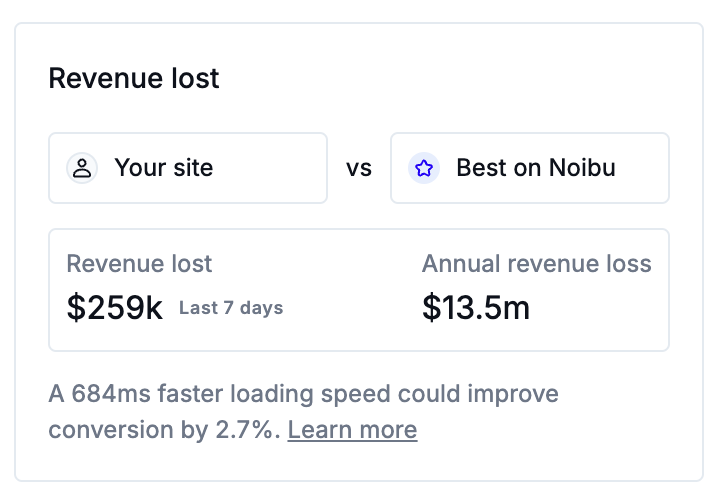
This section provides an estimate of the potential revenue impact poor loading speeds can have on your business. This number is estimated as a function of your domain’s average cart value, traffic to the page over the selected time period, and the difference between your site’s loading speed compared to Noibu’s best-in-class benchmarks. Learn more about this benchmark and how revenue loss is estimated.
Page Group Loading Speeds
If you have page groups configured for your domain, this section shows aggregate measures of key metrics for all pages within those groups: traffic within the selected time period, revenue loss estimate, and overall loading speed (LCP) score.
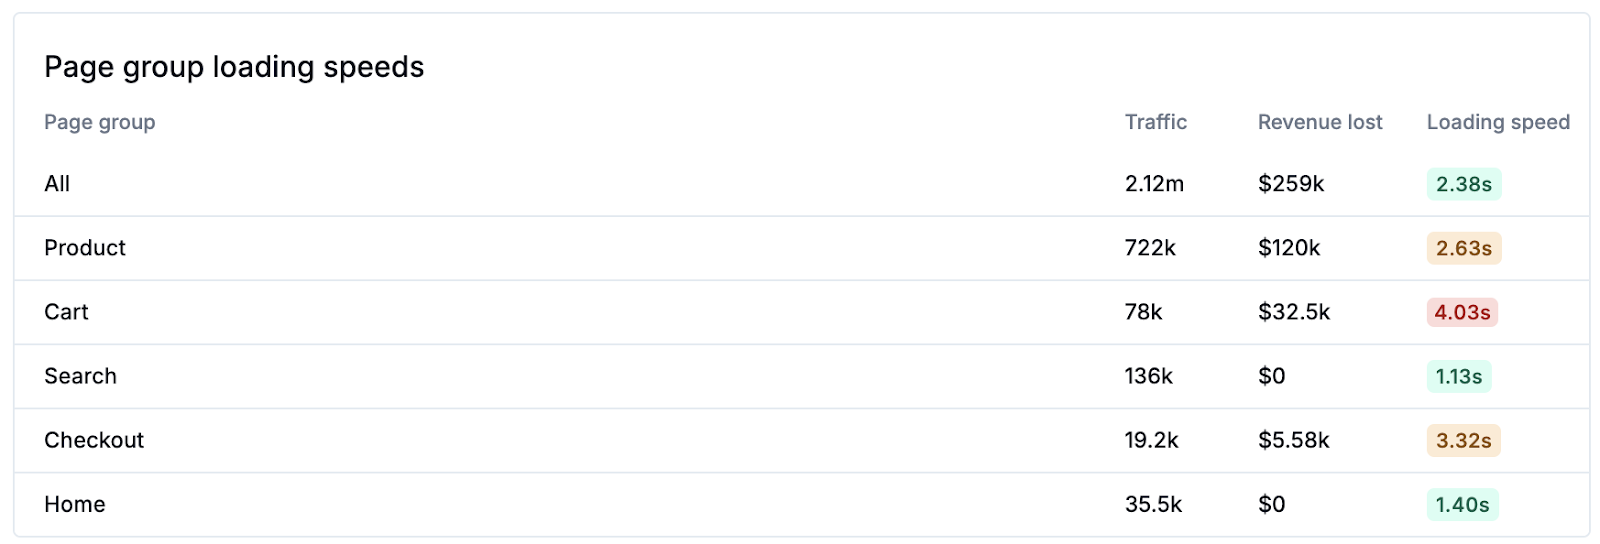
Clicking on one of these groups will provide a breakdown of time to first byte (TTFB), load delay, load duration, and render delay in more detail.
Similar to Top Opportunities, for each of these metrics, Noibu provides a brief description of what it is, your current score compared to a best-in-class benchmark, and links to relevant resources to help technical teams diagnose and resolve the problem. Learn more about diagnosing and resolving LCP performance problems.
Pages with poor loading speed
This section lists the top pages on your website with a “Poor” rating for loading speed (LCP). You can toggle this chart to show High Traffic (the highest-traffic pages with a “poor” score), Performance Drop (pages where the web vital score has deteriorated to a "poor" score), or Poor (pages with a “poor” score for this web vital, sorted by the highest traffic).
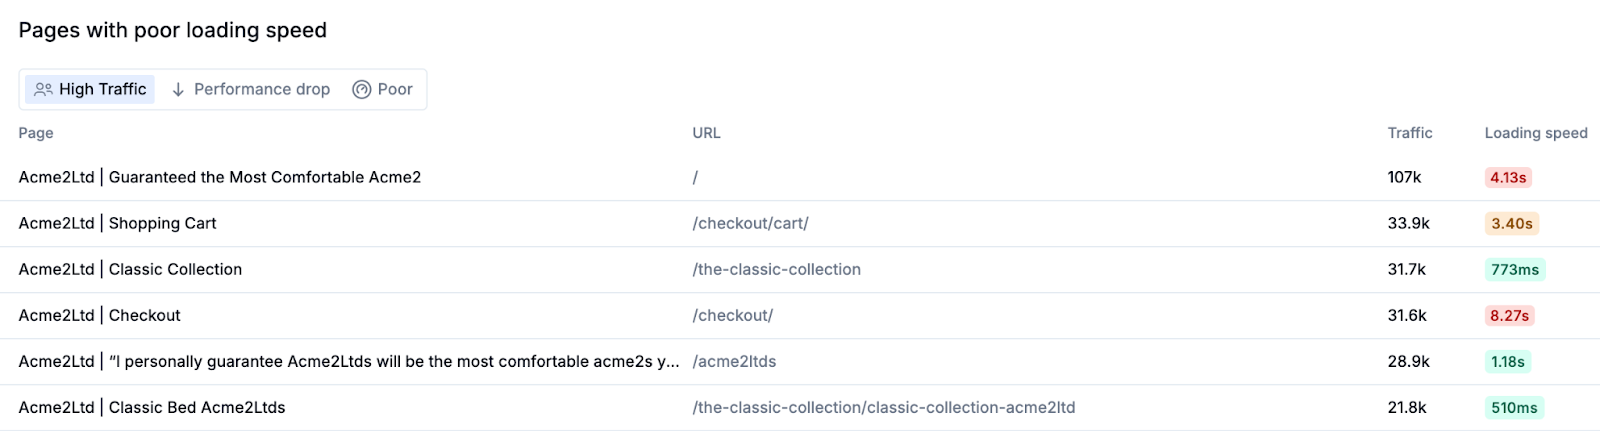
Each row in this table shows the relevant page title and URL, traffic for that page for the specified time range, and a visual indicator of each web vital’s score (“Good”, “Needs Improvement”, or “Poor”).