Release Event Reporting Overview
Last updated: March 20, 2026
Release Event Reporting in Noibu helps engineering and product teams evaluate the impact of code deployments by automatically comparing site behaviour before and after each release. Instead of manually correlating releases with downstream issues, Noibu provides a consolidated view of key technical signals tied to each release event.
For every release, Noibu analyzes data from one to seven days after deployment and compares it to the equivalent period from the previous week. This allows teams to quickly validate whether a release improved stability or introduced regressions.
Calendar page
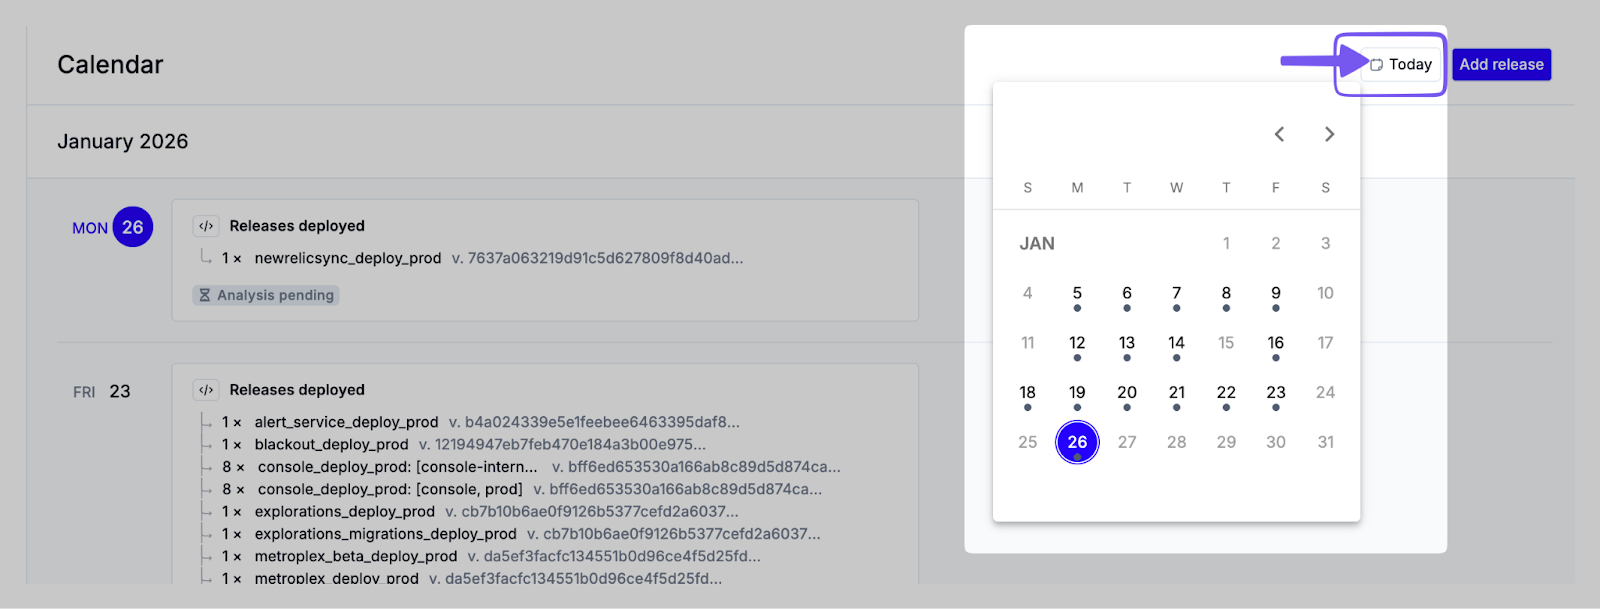
Starting from the Calendar page, you will see a reverse-chronological list of all release events for your domain, including any upcoming releases scheduled for the future (if available). Each entry represents a point in time when code was deployed and includes visual indicators to help teams quickly identify releases that may require attention.
Release reports become available the day after the release and update daily until seven days of post-release data has been collected.
The date control in the top-right corner allows you to jump to a specific date in the calendar. Days with release events are indicated with a dot.
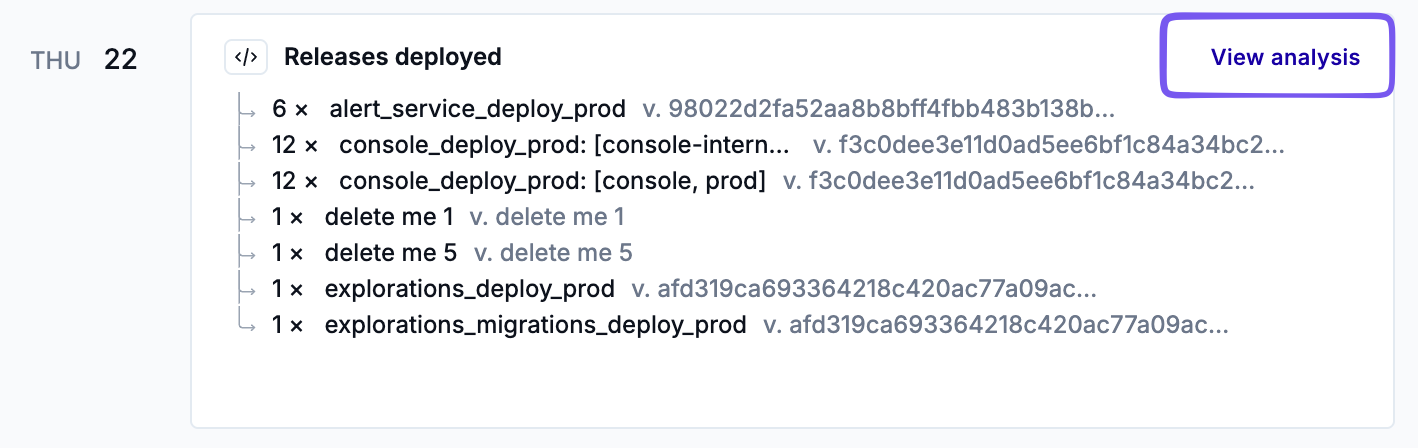
Click View analysis on any release to open its detailed release report.
Release analysis page
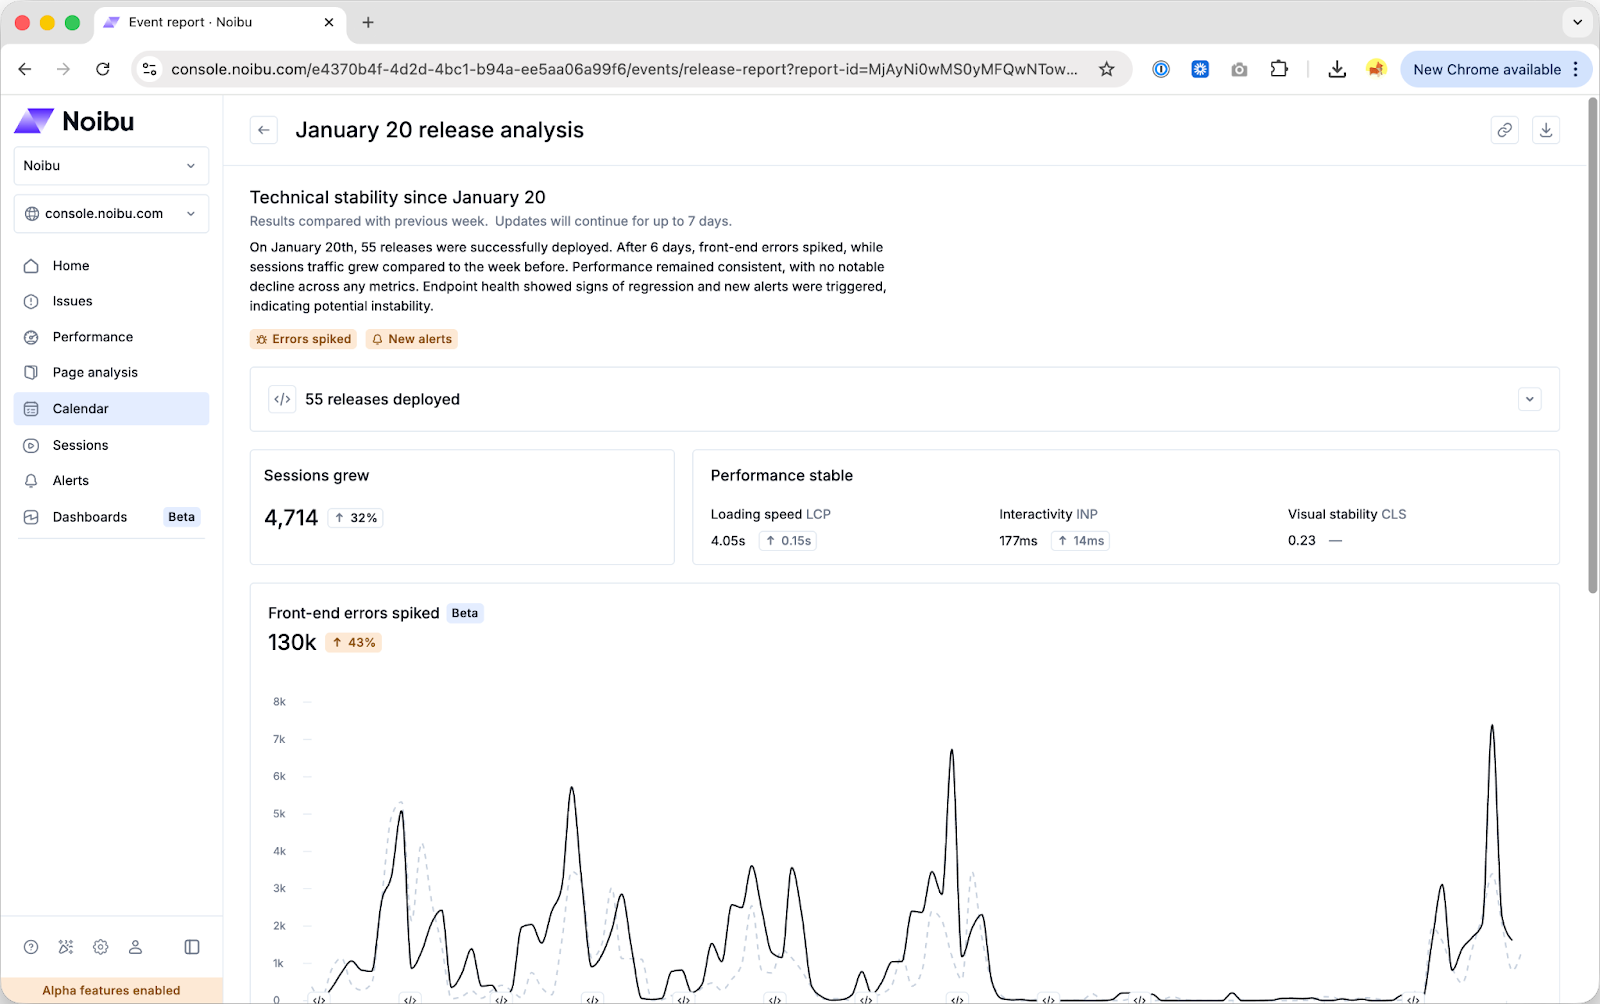
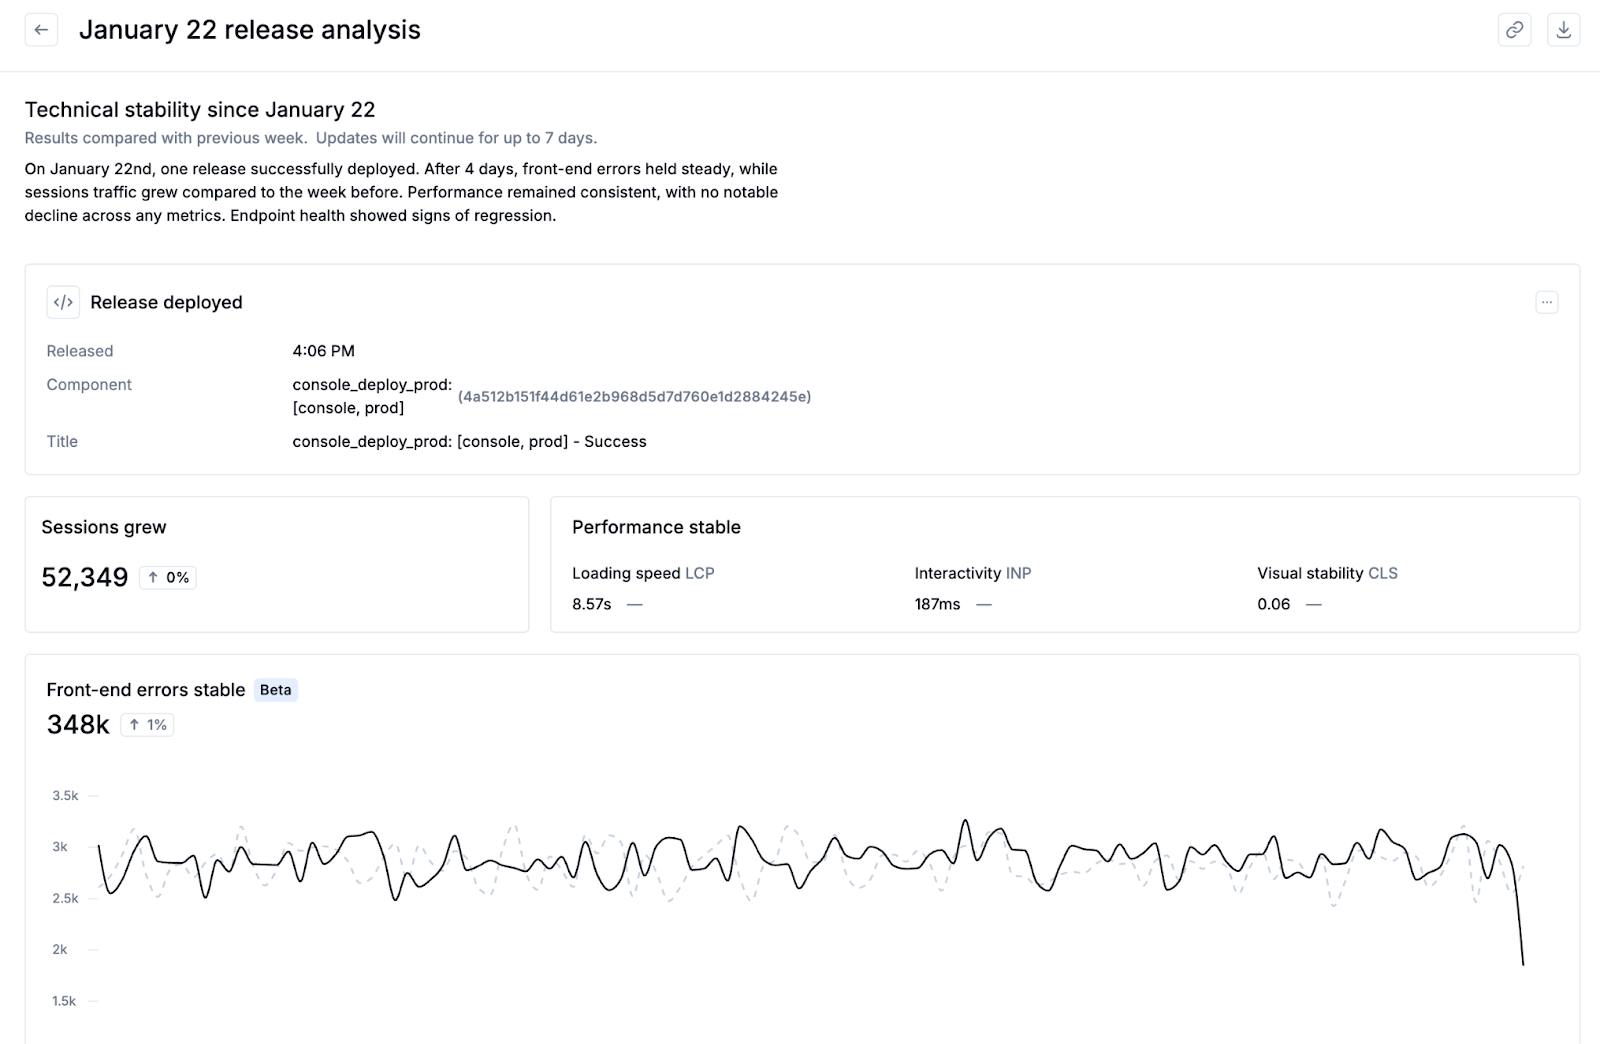
Clicking a release event from the Calendar page brings you to the release analysis page for a detailed analysis of technical metrics associated with a specific release. The report compares post-release behaviour to the same time period from the previous week, helping teams understand what changed after the deployment.
Note: Release event reports are only available for deployments on December 26, 2025 or afterwards
Each report includes:
Sessions: Total session count for the post-release window and the percentage change compared to the prior week.
Performance: Performance trends across loading speed, interactivity, and visual stability (core web vitals). Learn more.
Front-end errors: Changes in client-side error volume, with indicators for new or spiking issues detected by Noibu. Learn more.
Endpoint health: Regressions, failed requests, and overall endpoint stability, with indicators of failed requests. Learn more.
Alerts: Any alerts that were triggered after the release. Learn more.
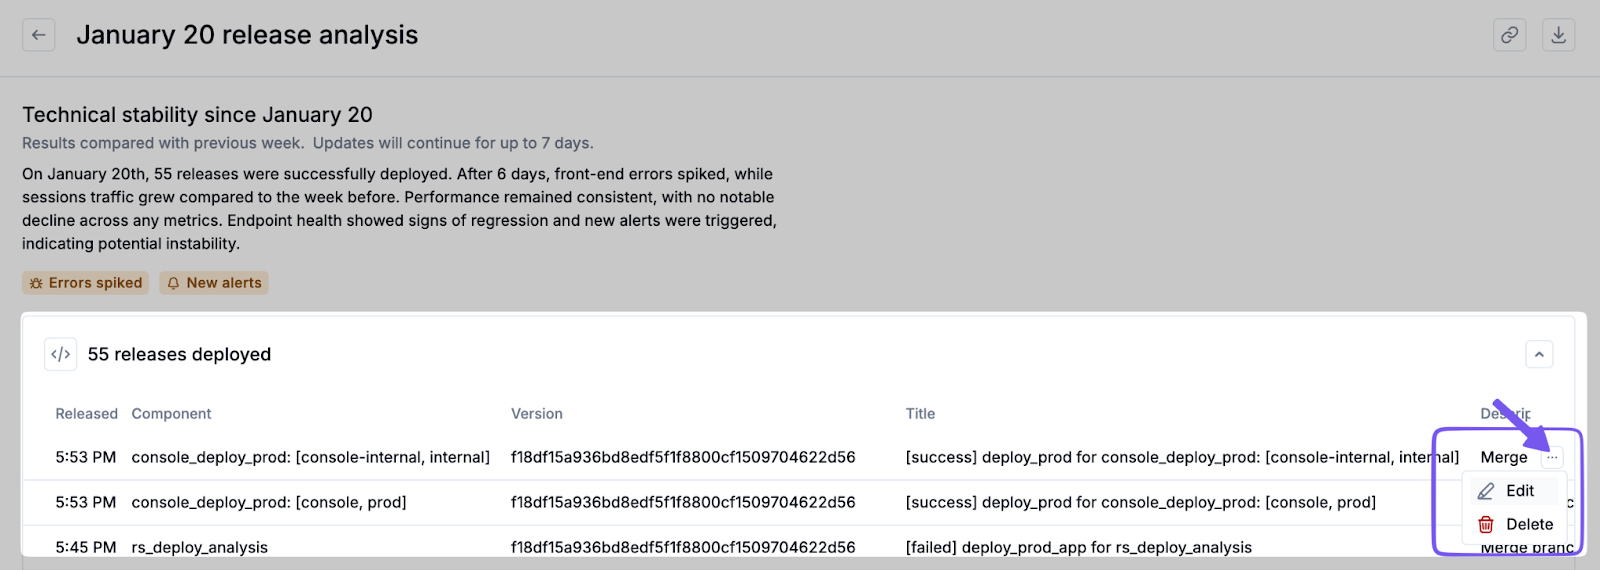
At the top of the page, a summary shows how many releases were deployed on the selected day. Expanding the Releases deployed section reveals additional details about each release, including:
Release title
Deployment time
Component (for example, front-end or back-end)
Version identifier
Description (if provided)
Where available, click the View details button on a metric to navigate to the relevant page in Noibu for more detail, automatically scoped to the same date range used in the release analysis.
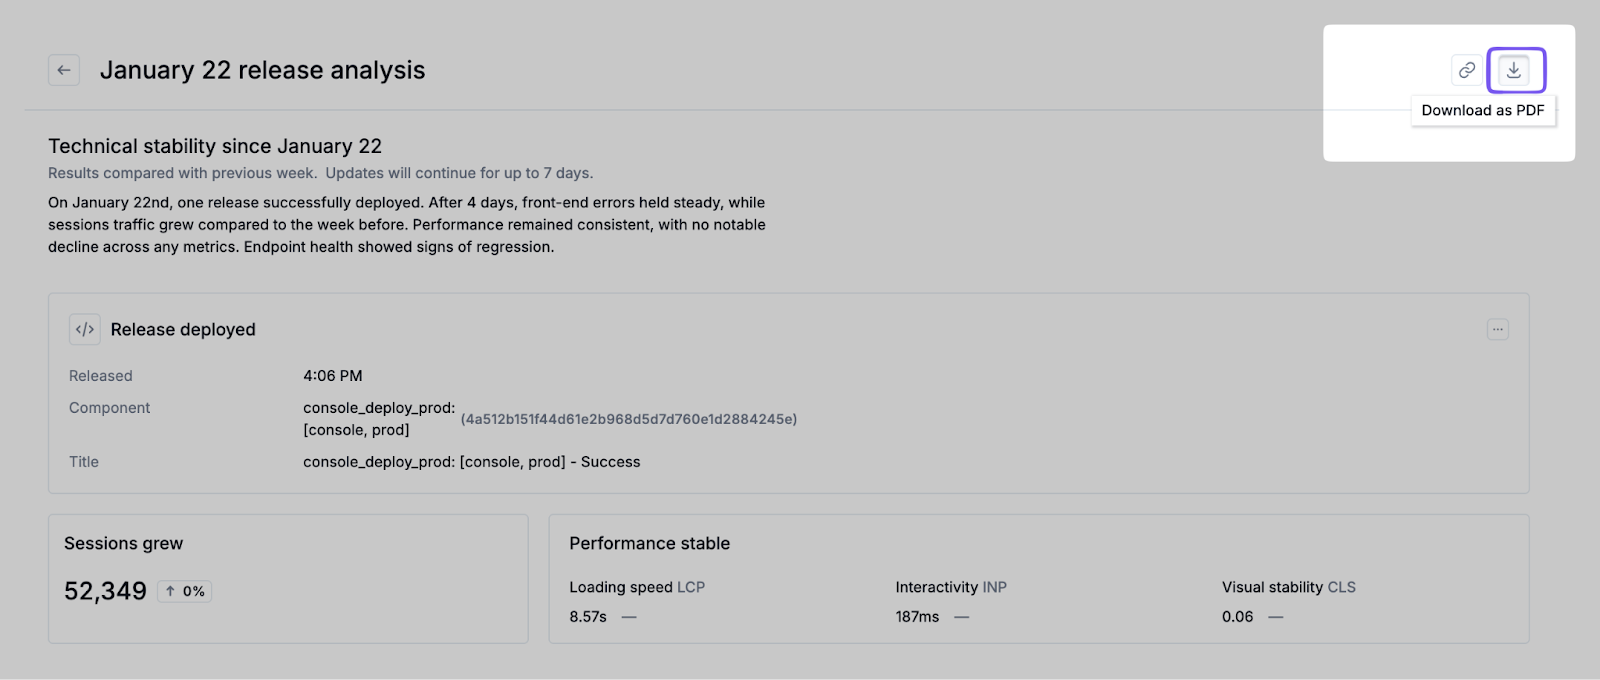
You can copy a link to the release analysis page, or export it as a PDF. This is useful for sharing findings with stakeholders or documenting post-release reviews.
How release analysis timing works
Release Event Reporting follows a defined comparison and retention model to ensure consistent and meaningful analysis.
All reports are compared on a week-over-week basis against the same day(s) of the week from the previous week. This avoids skew caused by normal weekday traffic and behaviour differences.
Release reports use a rolling analysis window to compare up to the last 7 days, starting from the date of the release. This continues until 7 days of post-release data are available, at which point the release report becomes a fixed snapshot.
For example:
Day 1 after release: compares 1 day of data to the same weekday from the prior week.
Day 2: compares 2 days to the equivalent 2-day period from the prior week.
Day 5: compares 5 days to the equivalent 5-day period from the prior week.
Day 7: compares 7 days to the equivalent 7-day period from the prior week.
After 7 days, metrics do not continue to roll forward beyond this window, ensuring consistent historical comparisons.
Release reports and calendar entries are retained for 83 days. This aligns with the retention limits of the underlying dashboards and metrics used in the analysis.
Viewing release events in charts
Across the Noibu platform you'll encounter charts that display trends over time -- for example, issue occurrences or core web vital scores. Release events are indicated on these charts with a icon.
Clicking the icon will show you a preview of release events that occurred on that date. This can help you correlate changes in trends with a release.

Configuring Release Event Reporting
Programmatic setup using webhooks
To automatically send release information to Noibu, configure a post-release webhook in your CI/CD pipeline. The webhook notifies Noibu whenever code is deployed and passes release metadata to your domain. This approach works with most CI/CD tools that support HTTP requests.
Note: If you deployed Noibu using the BigCommerce app, release monitoring for template changes is configured automatically. You may still wish to configure a webhook to capture other types of code releases.
Adding or editing a release manually
If you have not configured a webhook integration, or if you need to log a release retroactively, you can add a release manually from the Calendar page.
1. Click Add release.
2. Enter the required information:
Title
Component
Version
Date and time
Description (optional)
3. Click Save.
Manually added releases appear in the Calendar and are included in analysis once post-release data is available.
Releases can also be manually edited or deleted from the Release report page. You can edit or delete past and future releases, including those that already have analysis data.