Visual Stability (CLS) Details
Last updated: March 18, 2026
Cumulative Layout Shift (CLS) is a Core Web Vital that measures the visual stability of content on your site as a page loads.
Visual Stability Over Time chart
This chart provides a visual representation of trends in the relevant Core Web Vital over the time period selected. It plots overall visual stability (CLS) day by day for the time period chosen. Noibu provides historical reporting on this web vital for up to the past 180 days.
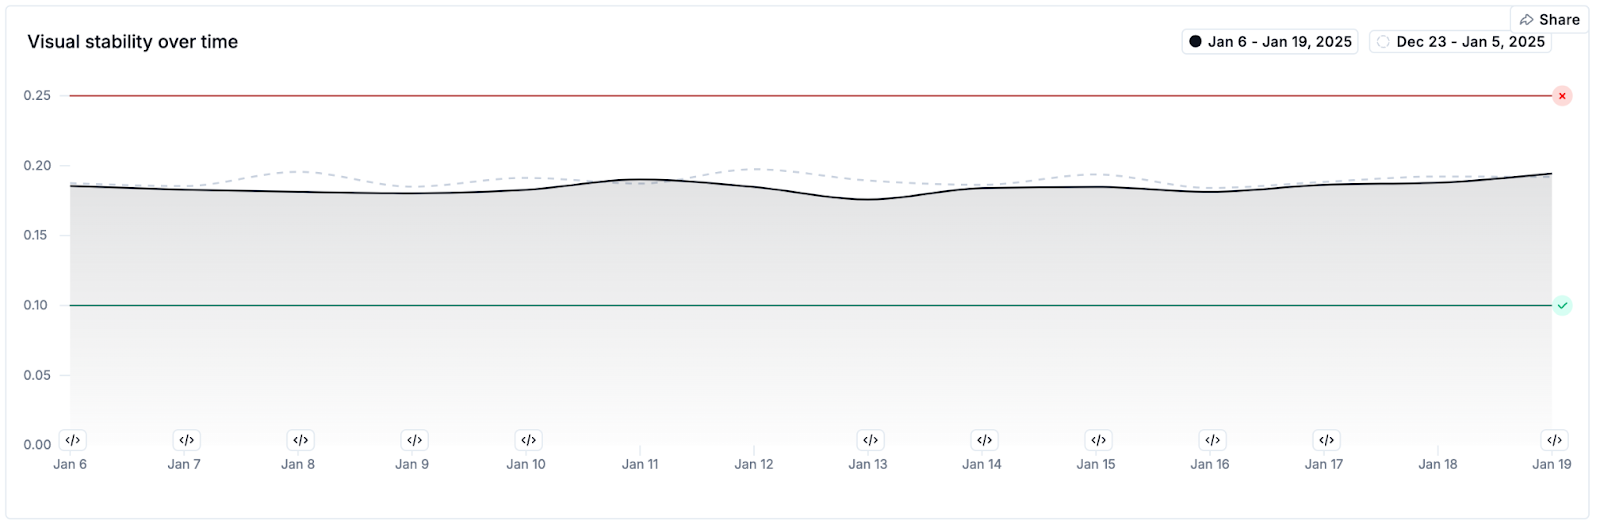
This chart can be interpreted as follows:
- The solid black line on this chart indicates your Core Web Vital measurement.
- The dotted grey line indicates the measurement over the prior measurement period (i.e. compared to 7, 14, 30, or 90 days ago). Comparing this line to the solid black line shows how performance has changed over time.
- The red line on this chart indicates the threshold above which the Core Web Vital would be considered “Poor”.
- The green line on this chart indicates the threshold below which the Core Web Vital would be considered “Good”.
- Core Web Vitals that measure between the red and green lines are considered “Needs Improvement”.
Hovering over a point in the chart displays a tooltip with the measurement at a specific date, as well as the prior period’s measurement.
The “Share” button at the top-right of this chart allows you to copy a link to this page with current filters applied, or copy the chart to your clipboard as a PNG.
If enabled, release events will be indicated along the horizontal axis of this chart via a icon. Clicking the icon will show you a preview of release events that occurred on that date. Learn more about enabling release events.
Pages with poor visual stability
This section lists the top pages on your website with a “poor” rating for visual stability (CLS). You can toggle this chart to show High Traffic (the highest-traffic pages with a “poor” score), Performance Drop (pages where the web vital score has deteriorated to a "poor" score), or Poor (pages with a “poor” score for this web vital, sorted by the highest traffic).
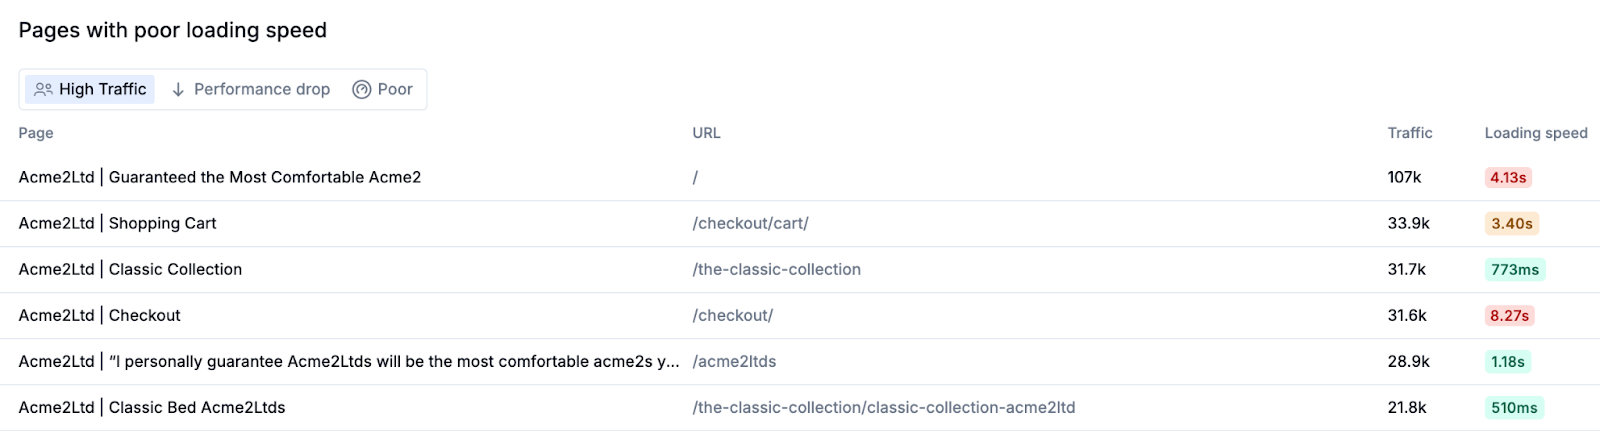
Each row in this table shows the relevant page title and URL, traffic for that page for the specified time range, and a visual indicator of each web vital’s score (“Good”, “Needs Improvement”, or “Poor”).