Identifying Performance Degradation & Opportunities
Last updated: March 18, 2026
The speed and responsiveness of an ecommerce website directly impacts user experience, conversions, and revenue. Slow or unstable sites can lead to cart abandonment and customer dissatisfaction. Noibu’s performance monitoring gives teams key performance metrics to help them diagnose and resolve performance bottlenecks efficiently.
As a general best practice, it’s recommended to check performance metrics at least once per month to keep tabs on your site, and even more frequently when actively making changes to address performance issues. Performance monitoring data in Noibu is refreshed daily.
Proactively monitor for performance degradations and opportunities
Most ecommerce businesses monitor and report on site performance at a regular cadence, making it essential to have an accurate and relevant source of data. Noibu’s performance monitoring gives you an understanding of how your site is performing, using the most accurate, representative data available: real user traffic from your site.
Exploring performance trends
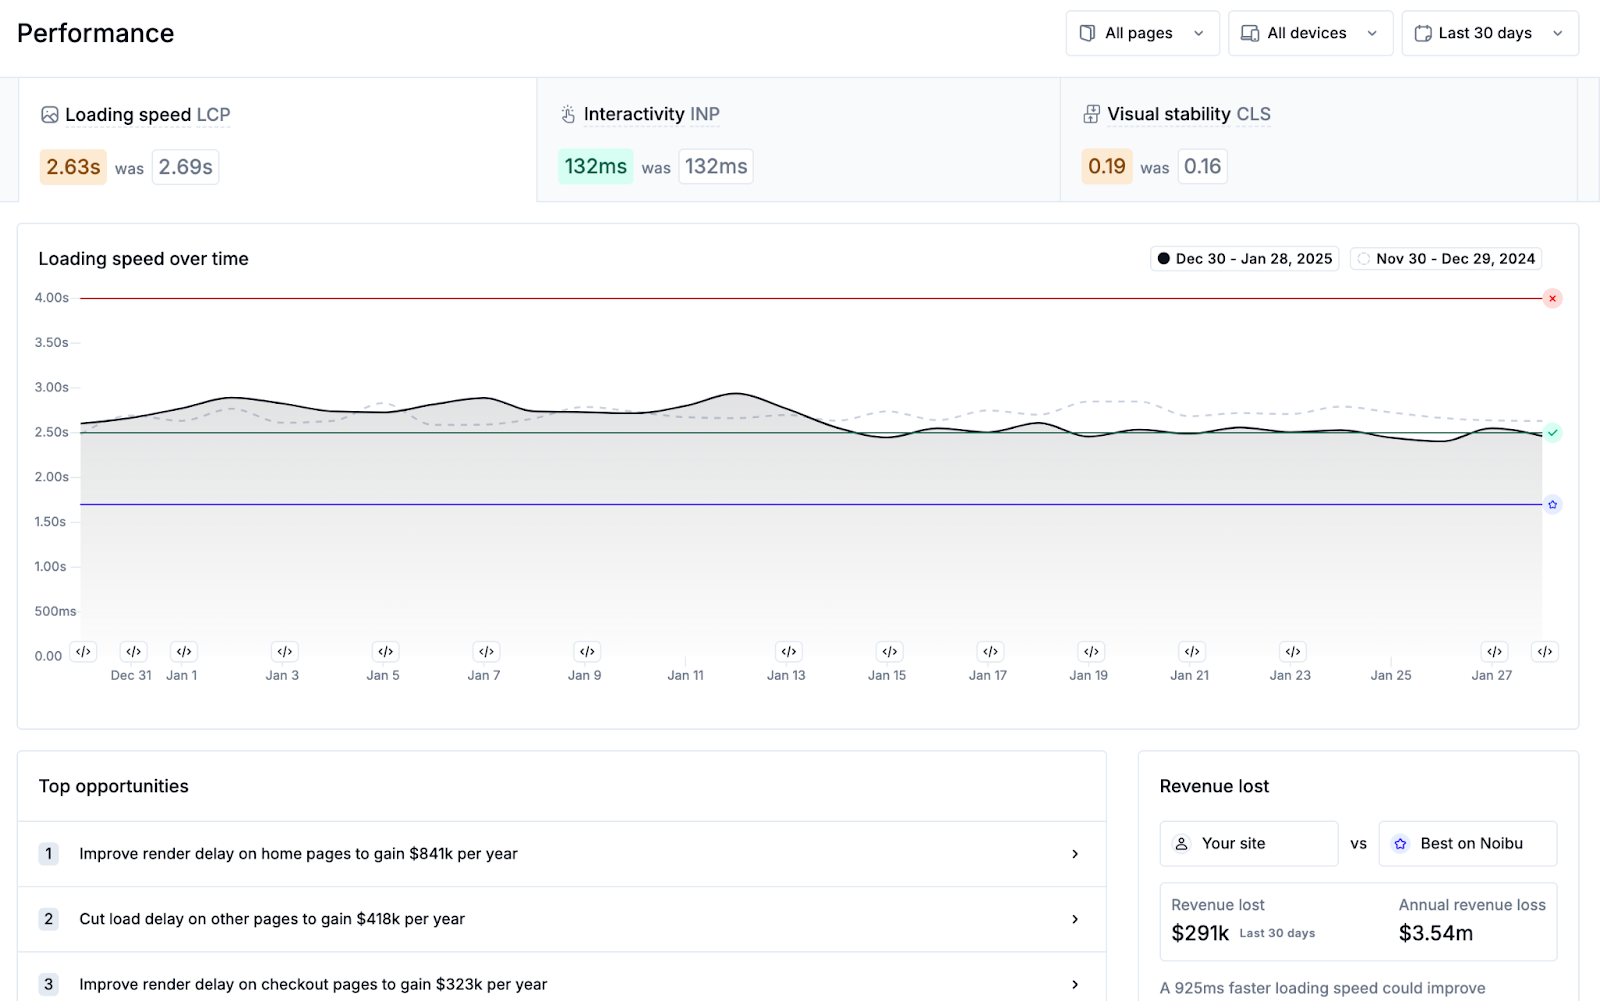
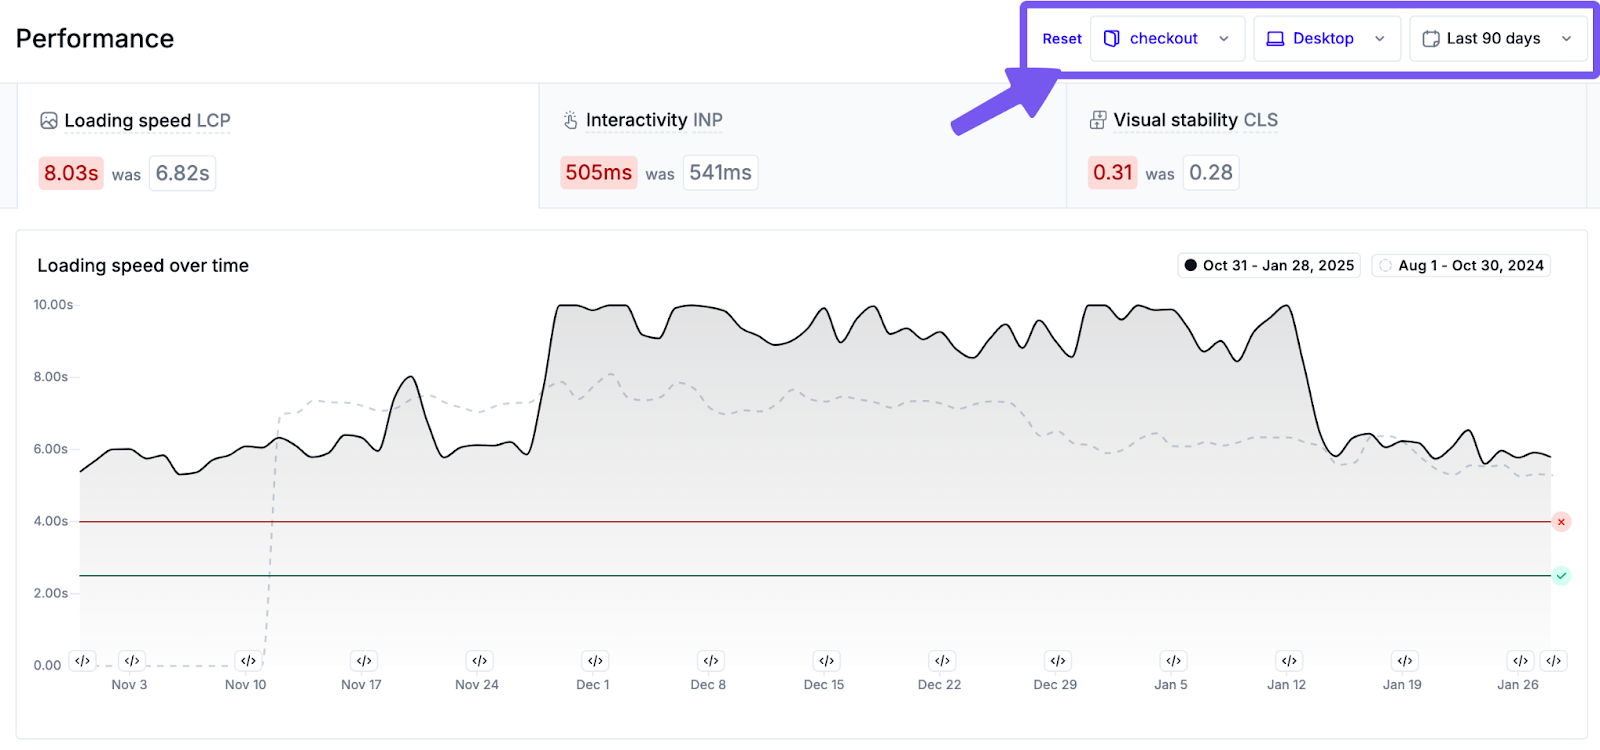
Review each tab of the Performance page (LCP, INP, and CLS) on a regular basis to proactively monitor for performance degradations or opportunities for improvement. Explore filters for page groups, devices, and time periods to identify trends worth investigating further.
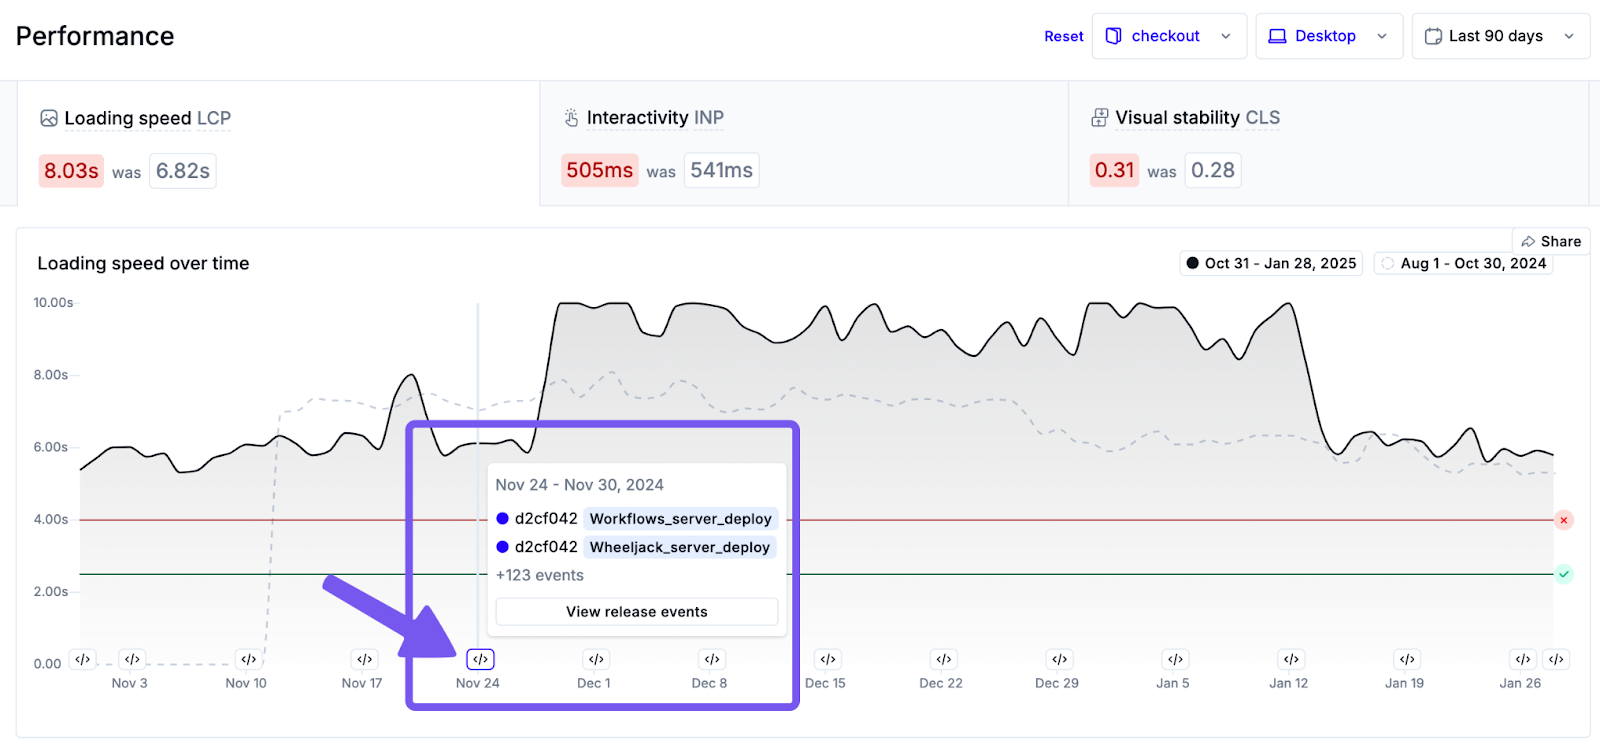
If your team uses Noibu’s release monitoring to track issues and performance trends following a release, you may also be able to correlate a recent deployment to a change in performance.
Reviewing performance insights
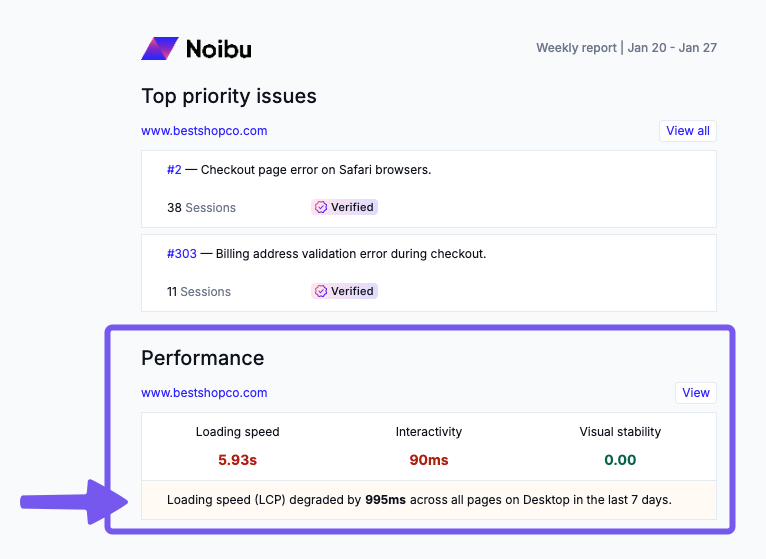
When applicable, specific performance insights are also presented in Noibu, as well as via email. These proactively identify performance degradations for specific page groups and/or device types.
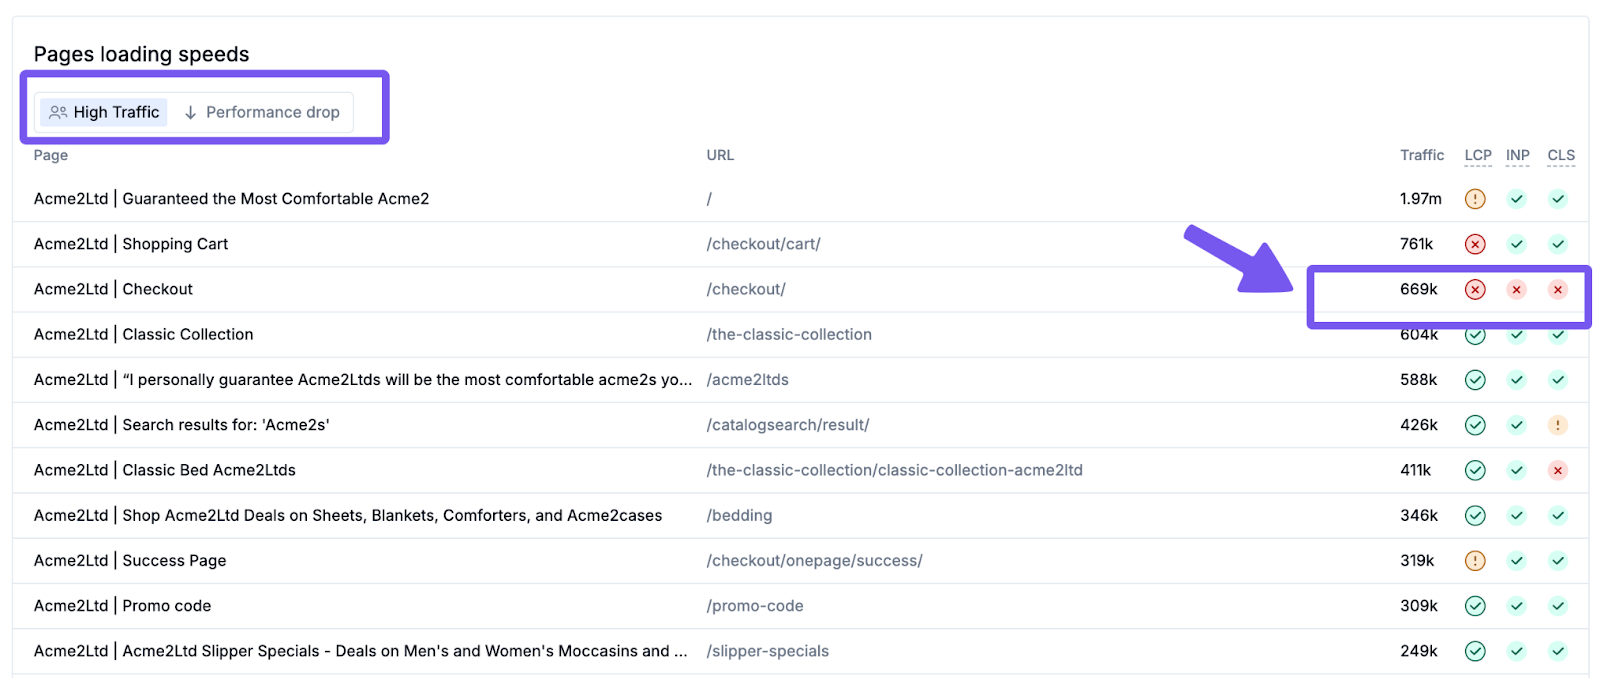
Identifying specific pages
At the bottom of each of the loading speed (LCP), interactivity (INP), and visual stability (CLS) tabs is a list of the highest-traffic pages and those that have recently degraded in performance. Examining this table can identify specific pages that may need investigation.
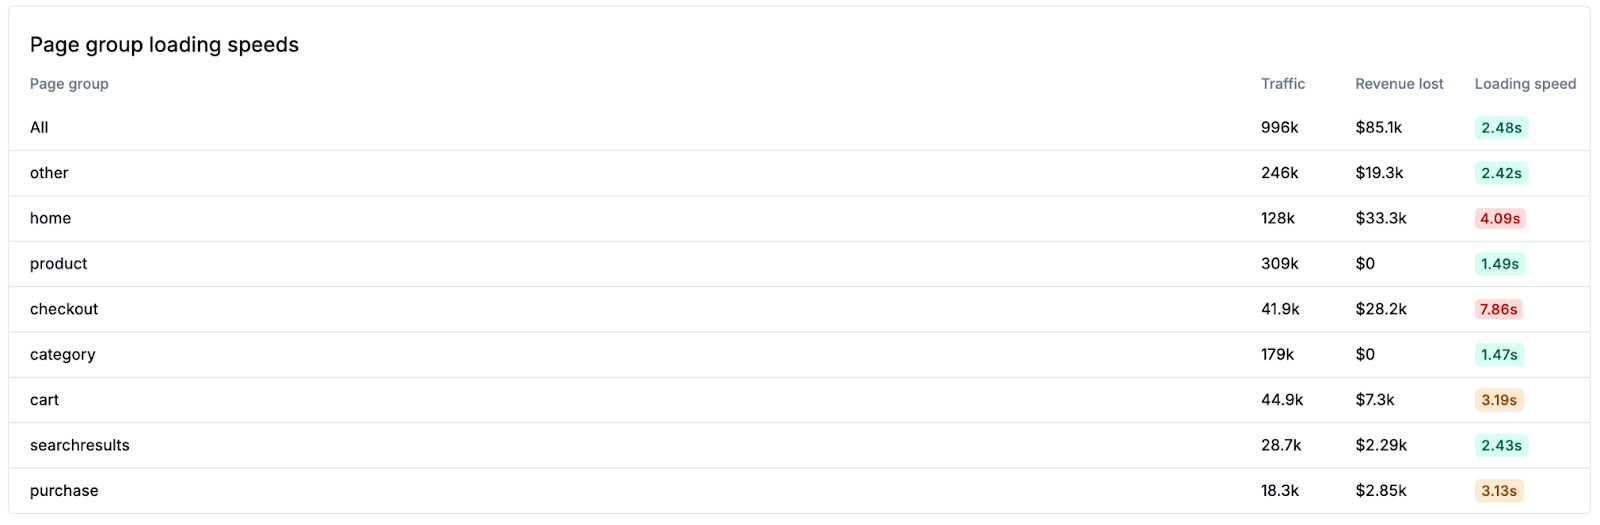
Loading speed opportunities
For the LCP metric specifically, investigate the Top Opportunities and Page Group Loading Speeds sections for an overview of the loading speed of each page group (e.g. product pages, homepage, collection pages). This table can help identify specific groups of pages that need investigation. Learn more about page groups.
After identifying a performance degradation or opportunity, you can investigate the specific metric in more detail.
Related articles: