Site Health overview
Last updated: April 15, 2026
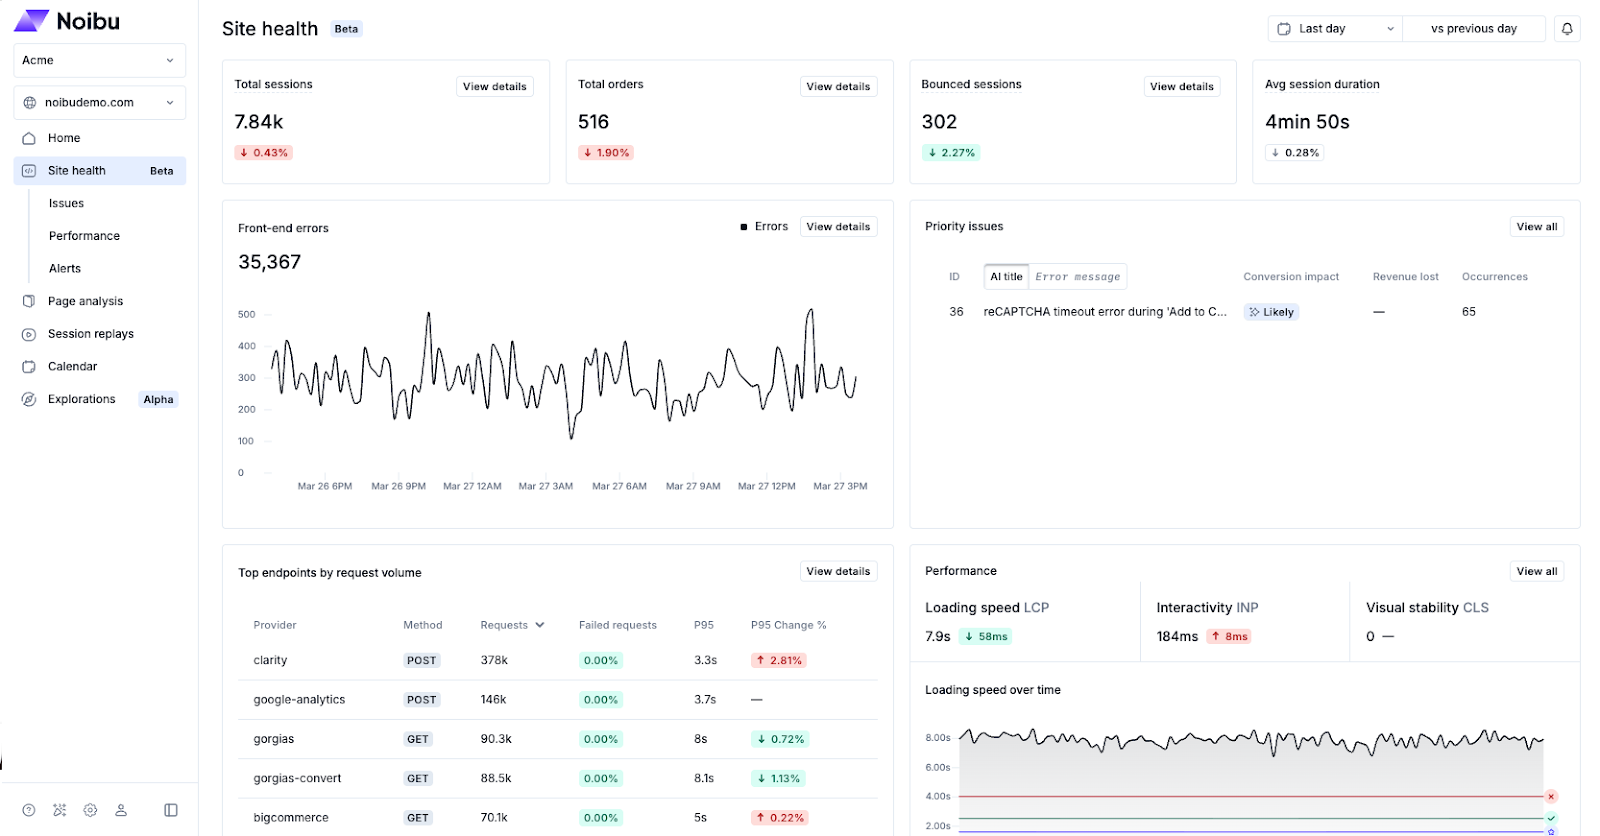
The Site Health page in Noibu gives ecommerce teams a unified, real-time dashboard showing how their site is performing. Rather than switching between separate tools to understand what's happening on your site, Site Health brings key commercial and technical signals together in one place — so teams can detect problems earlier and investigate them faster.
Site Health is organized as a dashboard that reflects distinct aspects of site performance. Each component surfaces metric trends and direct links into Noibu's investigation workflows, allowing teams to move from identifying whether key technical signals are stable or degrading, to the technical details that allow for deeper investigation.
Use the dropdown menu in the top-right corner to choose a time range for your data. Each chart on the dashboard will update to reflect the selected time range.
Business-level health metrics
Total Sessions: shows the total number of user visits to your site over the selected time range. Click View Details to see a detailed page related to this metric.
Total Orders: shows the total number of completed orders over the selected time range. Click View Details to see a detailed page related to this metric.
Bounced Sessions: shows the number of sessions where a visitor left after viewing only one page. Click View Details to see a detailed page related to this metric.
Avg Session Duration: shows the average length of a user session over the selected time range.
Technical health metrics
Front-end Errors: surfaces frontend error trends across your site, broken down by page, device, browser, and geography. Click View Details to see a detailed page related to this metric.
Priority Issues: surfaces the highest-impact issues currently affecting your site, ranked by their effect on conversions and revenue. Click View All to see all Priority Issues on your site.
Endpoint Health: monitors the availability and responsiveness of backend services like checkout, payment processors, and third-party APIs. Click View Details to see a detailed page related to this metric.
Performance: tracks Core Web Vitals — Loading Speed (LCP), Interactivity (INP), and Visual Stability (CLS) — across your site. Click View All to see all Performance details for your site.
Logs: shows anomaly trends in server-side log messages when the SFCC Logs Integration is enabled.
Note: for mobile monitoring, Site Health is displayed as "App Health" in Noibu. Performance metrics are unavailable at this time for mobile domains.