Page Analysis overview
Last updated: April 22, 2026
Page Analysis in Noibu shows user behaviour, technical issues, and performance indicators at a granular, page-by-page level. Like Digital Experience Analytics (DXA) tools, it helps product and UX teams evaluate the user experience after launching a new page or making iterative changes to existing pages.
By unifying user journey data, click & scroll data, technical issues, and performance monitoring metrics in a single view, teams gain a comprehensive understanding of how each page performs and where there may be opportunities to improve the user experience.
Choosing a page or page group for analysis
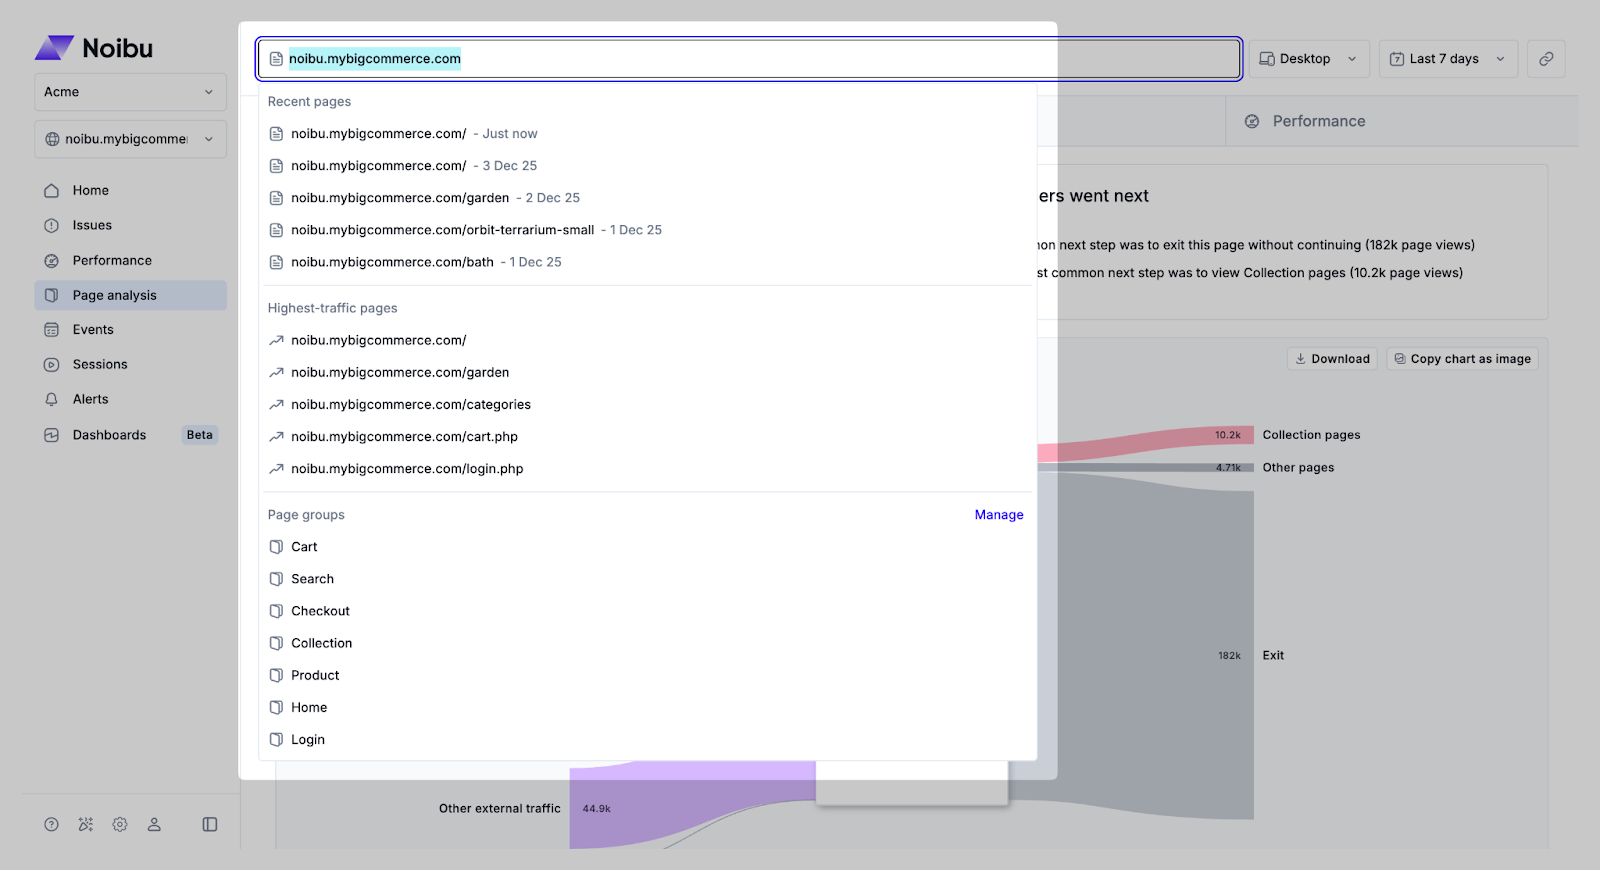
Begin analyzing a page by choosing a URL or selecting a Page Group (if configured). Noibu pre-populates your most recent and highest-traffic pages for quick access, but any site URL can be analyzed.
To get the most value from Noibu’s Page Analysis, we highly recommend configuring page groups for your domain. This allows you to analyze patterns of user engagement across common page templates like product pages, checkout pages, or search result pages. Learn more about configuring page groups.
Filter controls allow segmentation by device type (desktop or mobile) and time range (last 7, 14, or 30 days). Custom date ranges are also supported, up to a maximum of 30 days.
After selecting a page, the Journeys, Heat Maps, Issues, and Performance tabs will populate with data from the period of time selected.
Page-level engagement & business signals
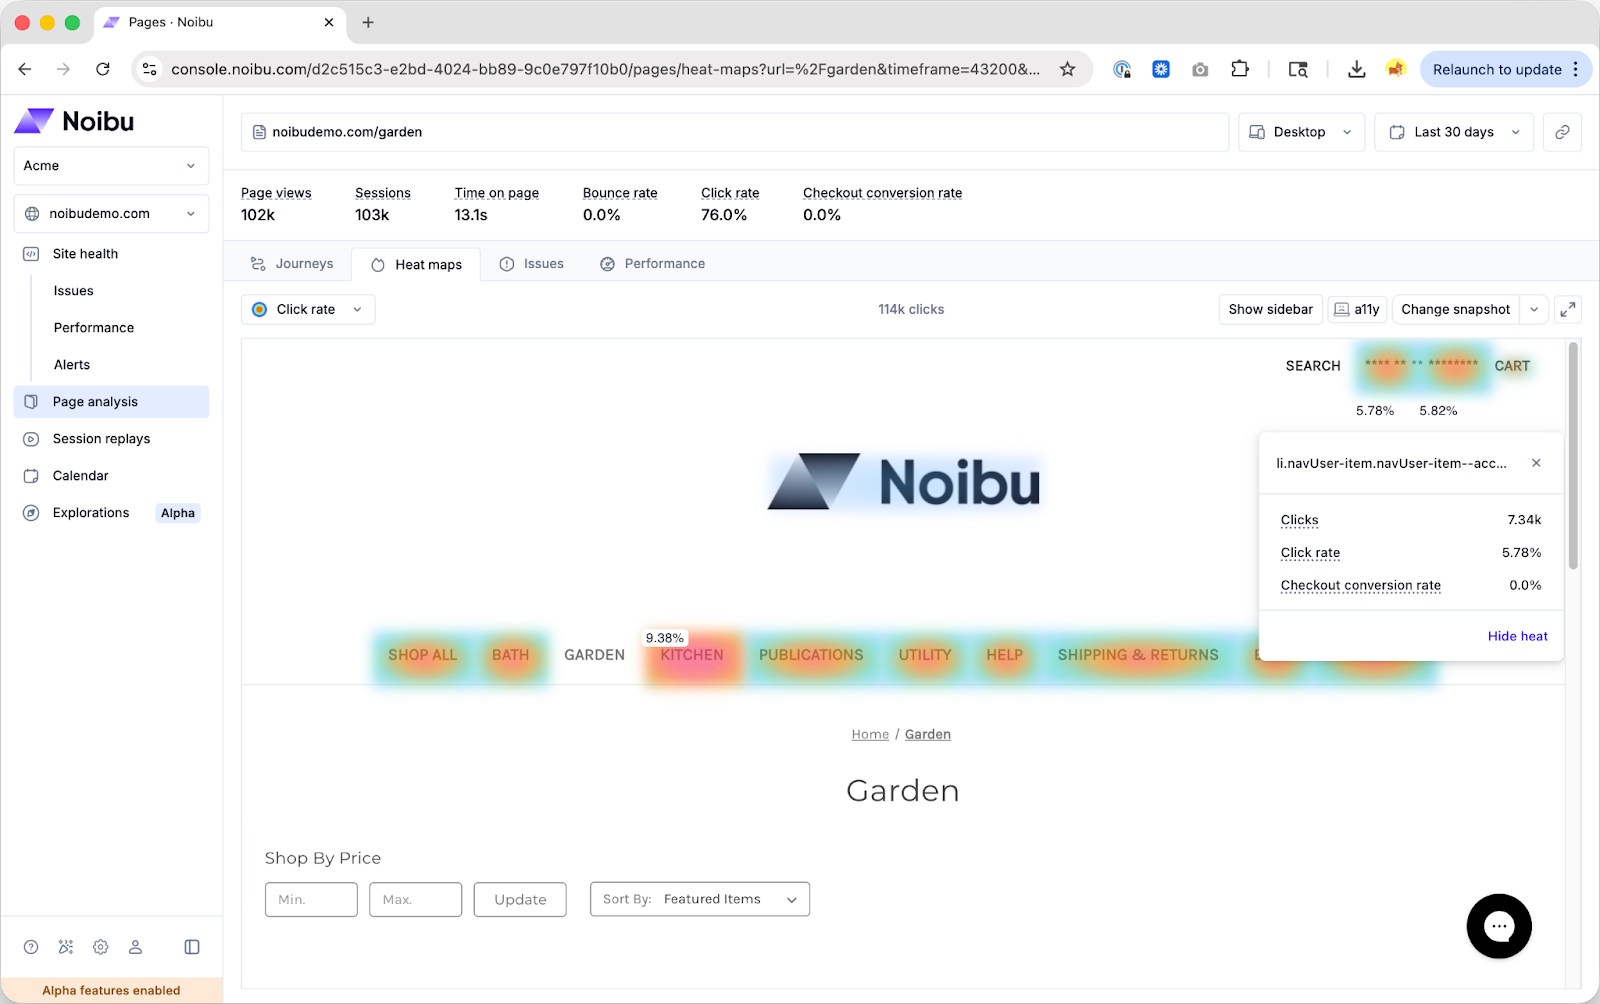
At the top of every page analysis view, a metrics ribbon shows overall page performance for the selected time period. The ribbon includes the following metrics:
Traffic
Page views: The total number of times this page was loaded in the selected period.
Sessions: The total number of sessions that included at least one view of this page.
Engagement
Time on page: The average time shoppers spent on this page per session.
Bounce rate: The percentage of sessions that landed on this page and left without any further interaction.
Click rate: The percentage of sessions that included at least one click anywhere on the page.
Business impact
Checkout conversion rate: The percentage of sessions that visited this page and completed a checkout. Use this to gauge whether a page is supporting the buying journey.
Revenue per session: The average checkout revenue generated per session that visited this page.
Learn more about how business metrics are calculated here.
Use the page-level ribbon to evaluate whether a page warrants further investigation before drilling into individual elements. A page with high session volume and a low checkout conversion rate is a different opportunity than one with lower traffic and a strong conversion rate — and the ribbon makes that visible immediately.
Enabling revenue metrics in Page Analysis
Checkout conversion rate and click rate are available to all customers with no additional setup required. Revenue metrics (revenue per session) require order data with purchase amounts to be sent in Noibu.
Revenue metrics require order data to be available in Noibu. It is automatically enabled for Shopify, BigCommerce, and Magento (Adobe Commerce Storefront Events SDK) customers.
For stores on other platforms, order data can be sent to Noibu using the track function in the Noibu JavaScript SDK. Use this function to send a checkout_completed event when a visitor completes a purchase. Within the checkout_completed event you must pass totalPrice with the sum of all the prices of all the items in the checkout, including duties, taxes, and discounts.
Once Noibu has this data, revenue metrics will be shown in Page Analysis.
Exploring Page Analysis
Each tab within Page Analysis provides a different layer of insight into how customers experience your ecommerce site. Together, they help you connect behavioural trends with technical and performance data to understand what’s driving or impeding conversions.
Journeys tab: Visualize how users arrive at and move away from a selected page. Trace inbound and outbound traffic, uncover high-exit pages, and identify navigation patterns that lead to or away from conversion paths.
Heat Map tab: See how customers interact with content on a page with click maps and scroll maps. Identify which elements attract attention, where engagement drops off, and whether key calls to action are visible without scrolling.
Issues & Performance tabs: Find technical and performance factors that may impact user experience or conversion. The Issues tab highlights trends in page-specific errors, while the Performance tab visualizes trends in Core Web Vital scores.
Reviewing all tabs together allows product, UX, and engineering teams to diagnose conversion bottlenecks holistically by seeing behavioural data and technical insight in one place.