Endpoint Health detail page
Last updated: April 15, 2026
The Endpoint Health page provides near-real-time insight into the responsiveness and reliability of backend APIs that power your ecommerce site. By surfacing latency metrics and failure patterns, it enables teams to monitor critical services—such as login, checkout, cart actions, and third-party payment providers—and quickly identify backend performance issues that impact user experience and conversion.
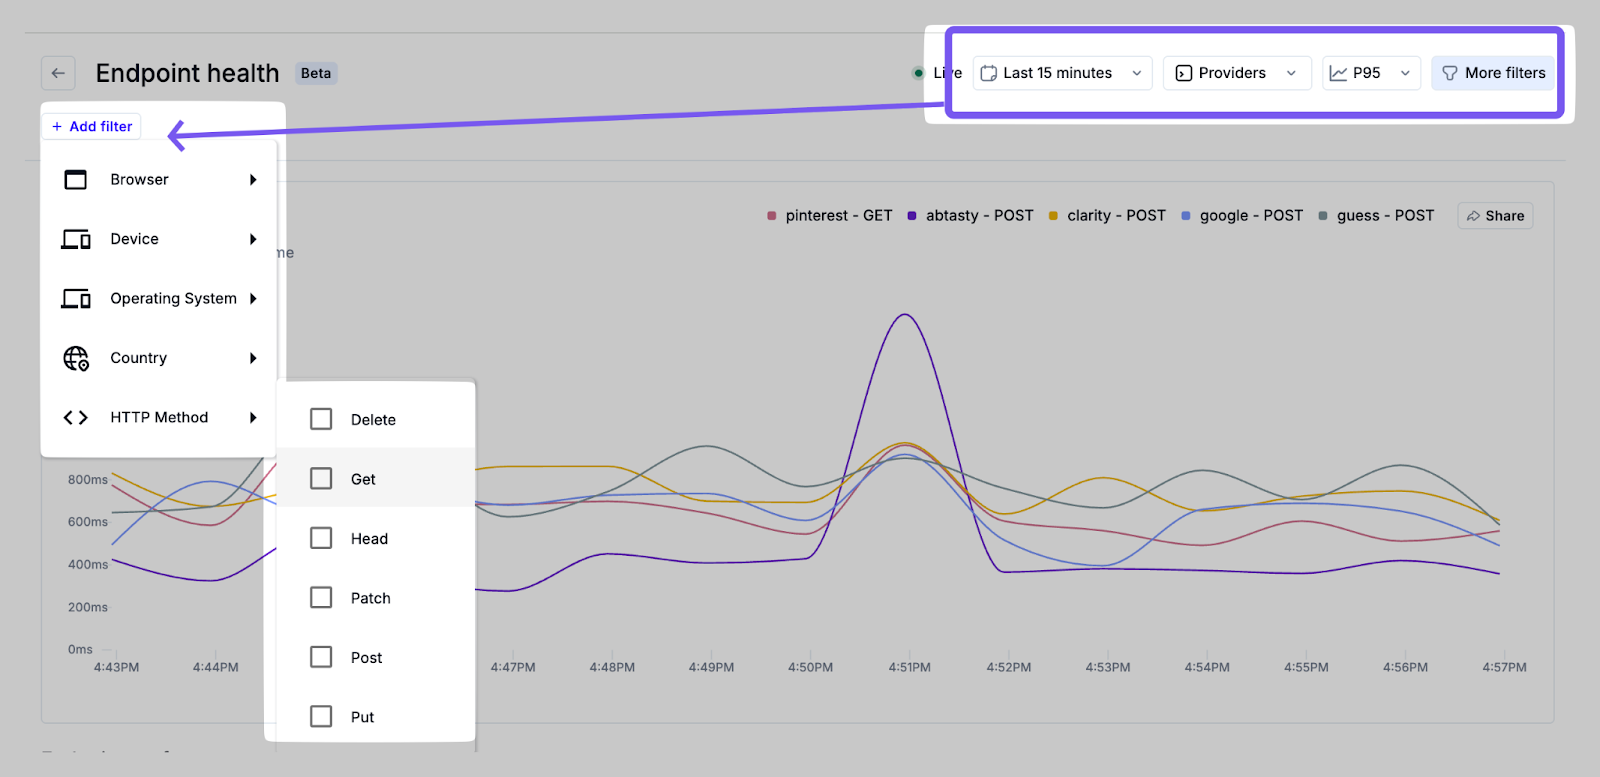
Several filters are supported to narrow focus and investigate specific issues. These filters allow for granular analysis, enabling teams to detect patterns such as geographic slowdowns or device-specific failures:
Provider – e.g. Shopify, PayPal, internal APIs.
HTTP Method – GET, POST, PATCH, PUT, etc.
Time Range – from last 15 minutes up to last 90 days, including custom date ranges
Browser, Device, OS, Country – Standard Noibu filters to correlate backend performance with frontend environments.
Response Time Graph
The primary graph visualizes the top providers by request volume within the selected time window. This high-level summary helps identify which backend services are seeing the most traffic, enabling teams to prioritize monitoring efforts accordingly. Updated in real-time, you can hover over the graph to see specific latency values, or click and drag to define a custom date range for the chart.
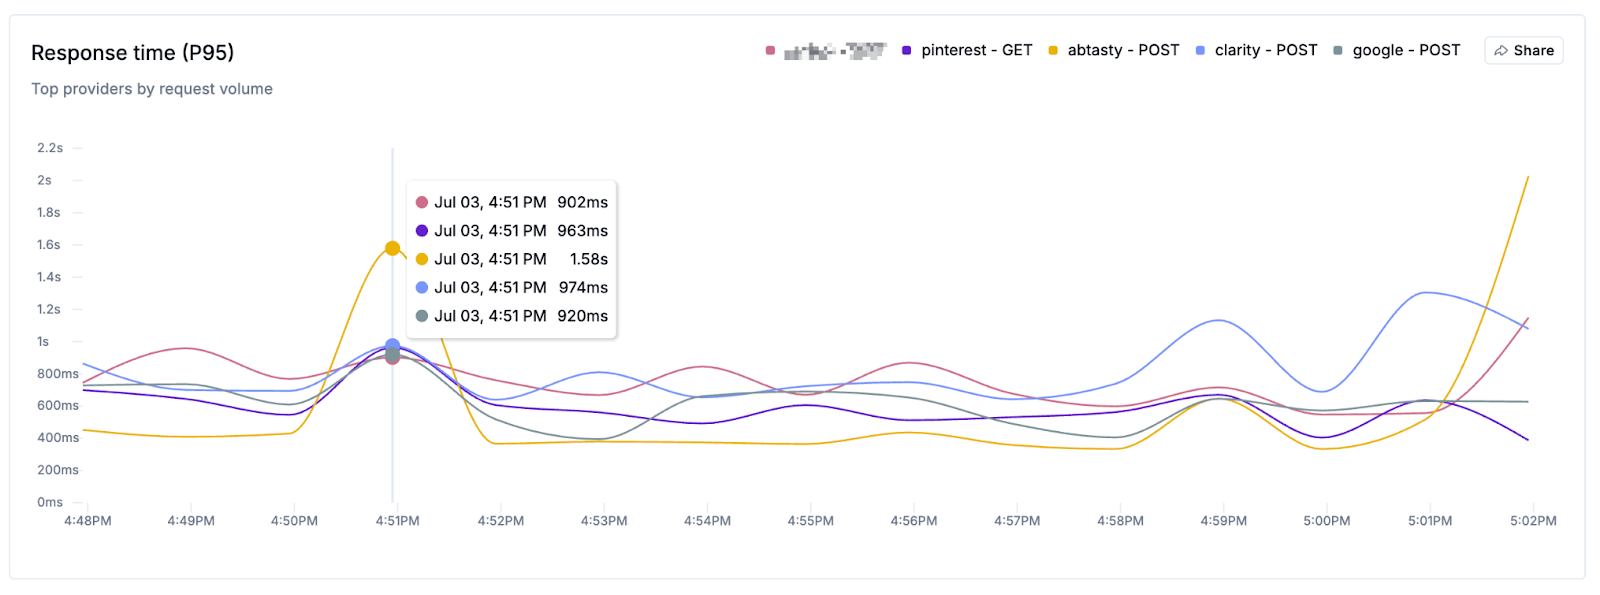
The Share button allows you to copy an image of the chart, or copy a link to the current page to share with teammates.
If release monitoring is enabled, a icon indicates release events on the horizontal axis of this. Clicking the icon will show you a preview of release events that occurred on that date.
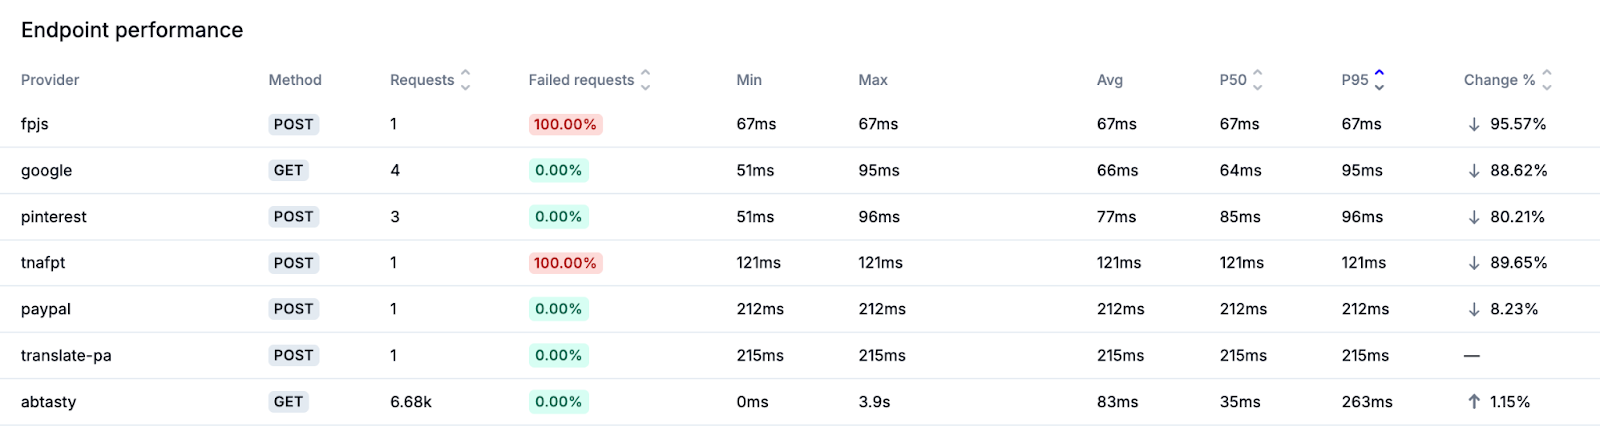
Endpoint Performance Table
Below the chart is a sortable table showing detailed endpoint-level metrics, including provider, HTTP method, number of requests, failure rate, and key latency indicators such as P50, P95, and P99. This table can be sorted by clicking on the column headers.
Latency Metrics Explained
Latency is measured in milliseconds (ms) and indicates the time it takes for a backend service to respond to a request. P95 is the industry standard for performance benchmarking, as it highlights the slower edge of the user experience that still affects a significant portion of traffic. However, the dashboard supports multiple latency percentiles to reflect both typical and outlier user experiences:
Min – Fastest observed response time.
Max – Slowest observed response time.
Average – Mean response time across all requests.
P50 – Median latency; 50% of requests are faster than this value.
P95 – 95th percentile; only 5% of requests are slower than this value.
P99 – 99th percentile; only 1% of requests are slower than this value.
Endpoint Details Panel
Clicking on any row in the Endpoint Performance table opens a side panel showing detailed information about the selected endpoint.
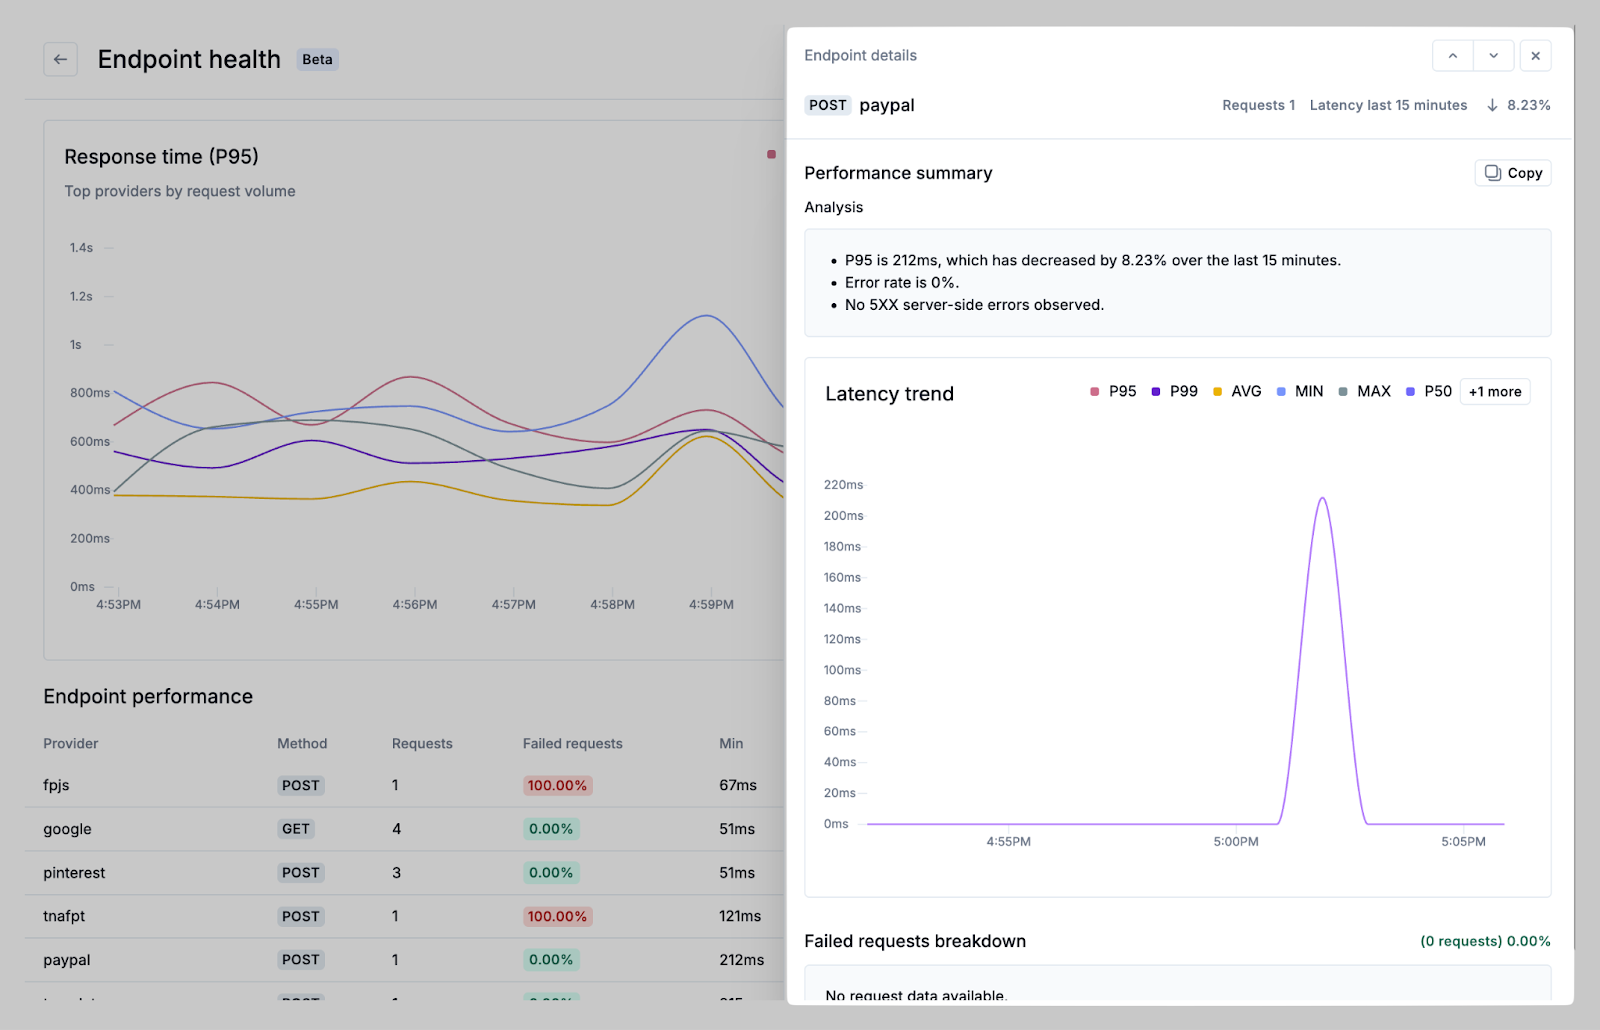
This panel includes:
Latency trend chart – Graphs for min, max, average, and percentile latencies over time.
Failed requests breakdown – Information on HTTP status codes, method, and failure rate.
Response code distribution – Chart and summary of failed request rates and failure types.
This panel helps teams understand performance degradations, investigate incidents, and differentiate between frontend and backend root causes.
Sharing Insights
Charts and data views can be shared directly. Use the Share button to:
Copy the chart as an image for reporting.
Copy a direct link to the filtered view.
Export JSON or text data from the details panel for offline analysis or to share with external teams.
Latency Benchmarks
While performance standards vary by context, the following P95-based thresholds provide general guidance in helping ecommerce teams prioritize endpoint failures early.
Endpoint Type | Great | Acceptable | Warning | Critical |
Login / Auth | 300ms | 300–700ms | 700ms–1.5s | > 1.5s |
Product Listing / Search | 500ms | 500ms–1s | 1–2s | > 2s |
Add to Cart / Cart Load | 400ms | 400–800ms | 800ms–1.5s | > 1.5s |
Checkout Steps | 600ms | 600ms–1.2s | 1.2s–2s | > 2s |
Third-Party Services | 800ms | 800ms–1.5s | 1.5s–3s | > 3s |
Background APIs | 1s | 1–2s | 2–4s | > 4s |