Viewing Logs within Session Replays
Last updated: March 19, 2026
When the logs integration is enabled, back-end log messages from your ecommerce platform are linked to individual session replays captured by Noibu.
Filtering sessions with logs
You can filter the sessions page by specific log types (error, warning, or fatal). In combination with other filters (e.g. browser type, OS, or URL), this can help you find and review user sessions specifically associated with server-side problems. If the session contains additional custom attributes (e.g. order ID), you can narrow your search even further to find specific sessions.
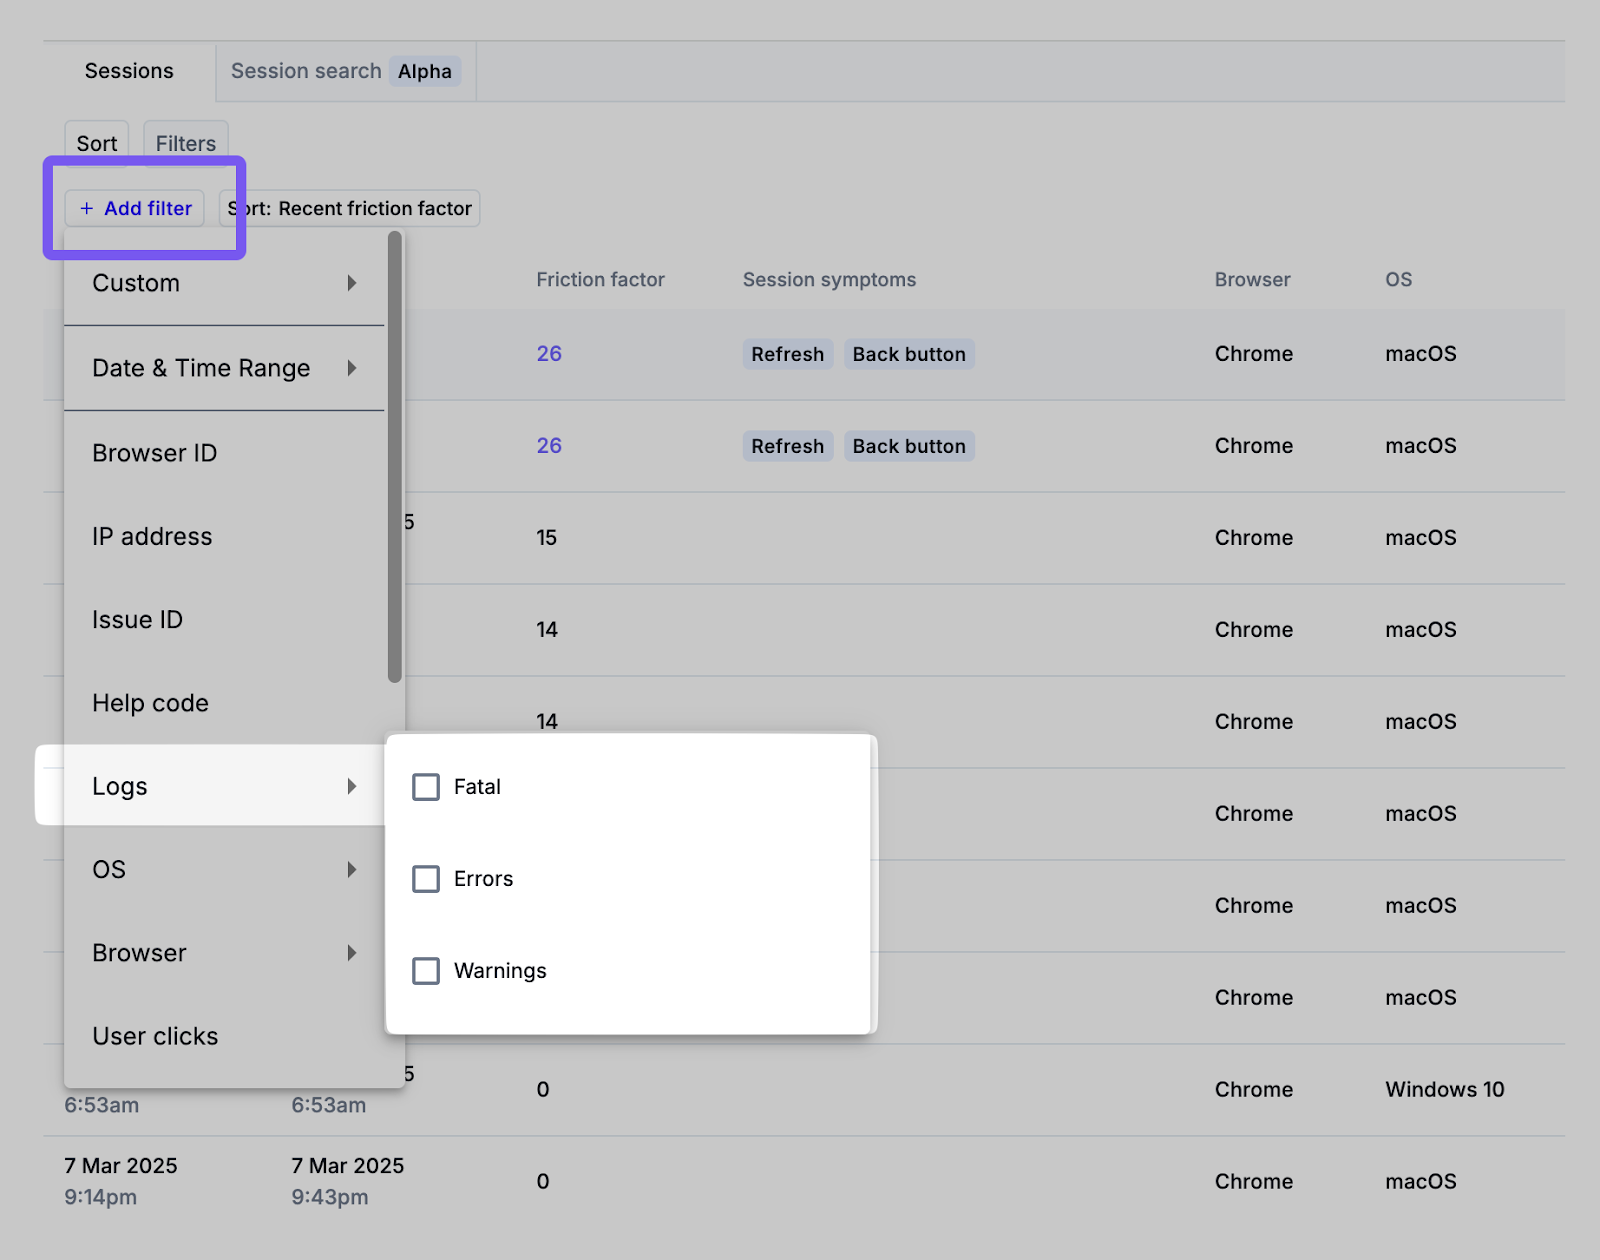
Clicking on any row in the table will open a panel where the session replay can be reviewed in detail.
Reviewing log details in sessions
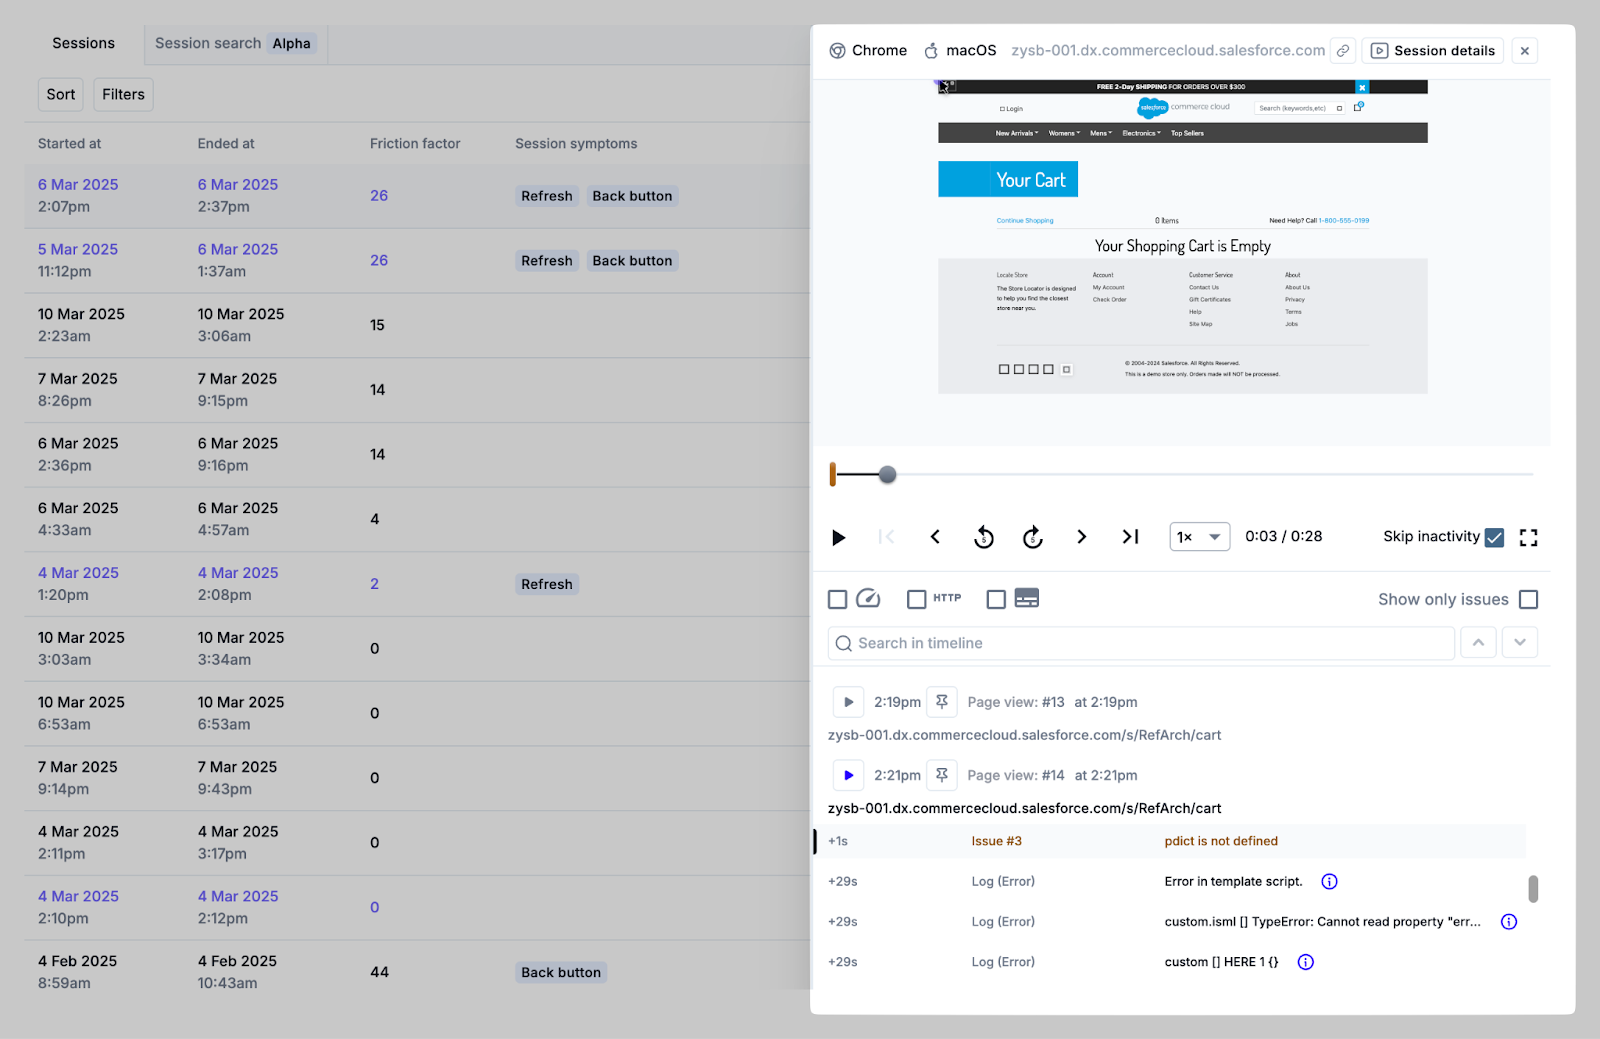
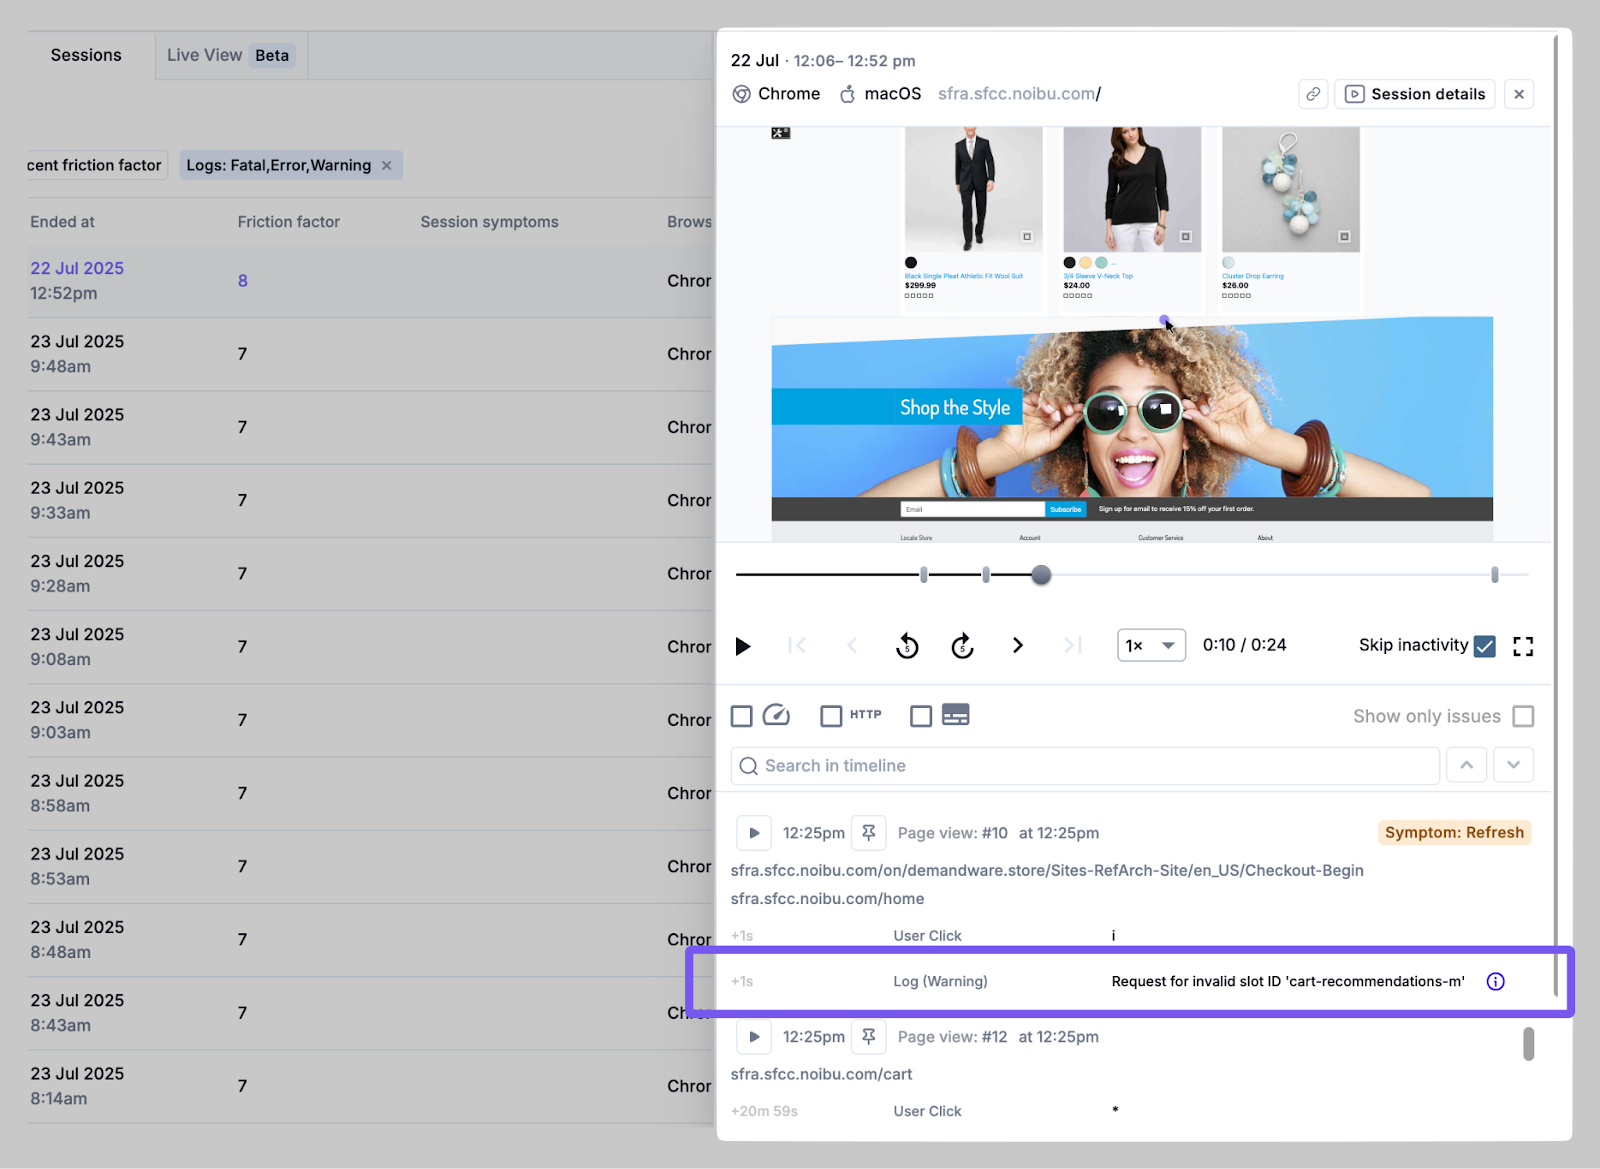
During playback of a session replay that includes logs data, any relevant error, warning, or fatal log events will be displayed in the session timeline. Clicking the “i” icon next to the log will open a new tab with full session and log details.
The log details panel will indicate the severity, time of occurrence, and full log message text. In combination with the client-side context from the session playback, teams gain a comprehensive view of the error, which can shed light on how to debug and resolve it.
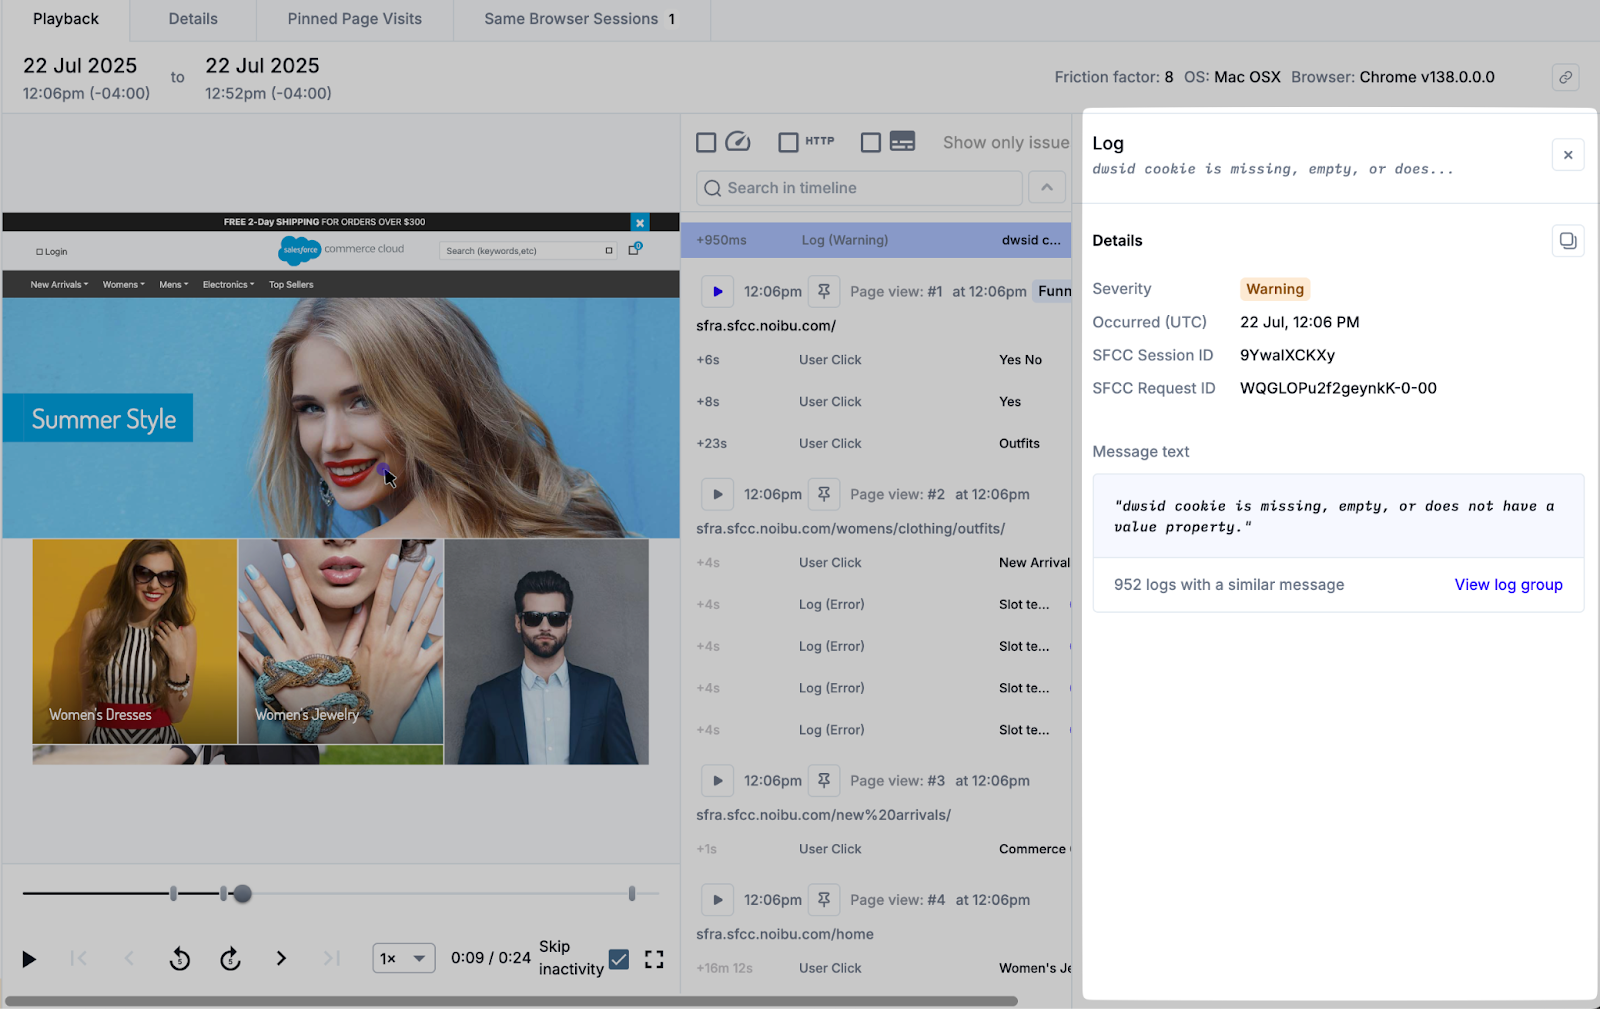
For example, if Noibu shows the user experiencing a client-side “payment failed” error on your site, logs ingested from your ecommerce platform may indicate the payment gateway API failed. With this integrated insight, teams can confirm the customer-impacting issue was caused by a back-end problem with the payment gateway, not a client-side input problem.
Clicking the View Log Group link will take you to a details page where a group of similar log messages can be analyzed further.