Measuring A/B test results
Last updated: September 21, 2026
Overview
Once an A/B test is running (see Creating an A/B test and Implementing an A/B test), the results page tells you whether a variation won, by how much, and how much confidence to place in that call. It also runs automatic technical health checks, so you can see whether a result was shaped by errors or slow page loads rather than by the change you made.
Noibu is honest about data maturity. Early in a test it tells you plainly that it is still collecting data. As evidence builds it shows which direction the results are leaning, while making clear that no definitive winner has emerged. Only when confidence passes the threshold does it name a winner.
Note: This feature is currently in beta. Beta features are still in development as we test and evaluate. They may have limited functionality and can change without notice.
How Noibu evaluates a result
Noibu uses Bayesian statistics, which expresses an outcome as a probability rather than as a pass or fail. Instead of telling you a result is “significant,” it tells you there is a 96% probability that a variation beats the control. This is easier to act on, because it states how likely you are to be right rather than whether an arbitrary threshold was crossed.
Before any verdict is available, a test must clear three minimums. Every variation needs at least all of the following:
25 conversions on the primary metric
500 sessions
7 days of run time
These gates exist because early data is noisy. A variation can lead comfortably in the first two days on a handful of conversions and then revert entirely. The minimums prevent a winner from being called on a result that will not hold, and the seven-day floor makes sure a test covers a full weekly cycle rather than just a few weekdays.
Test states
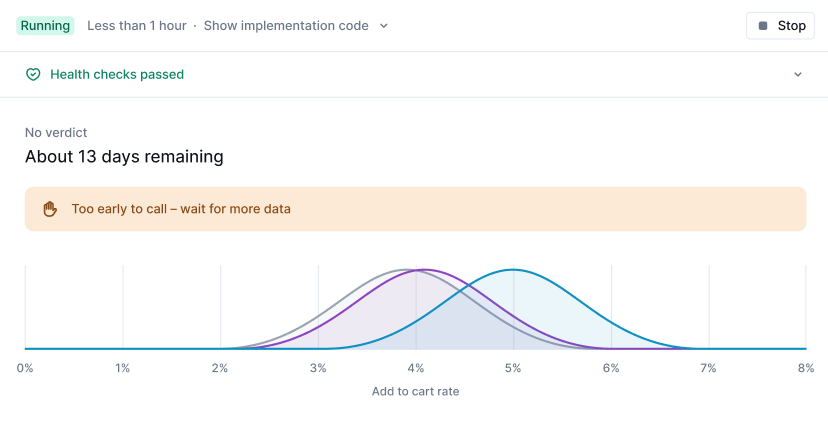
Every test sits in one of four states, shown in a banner at the top of the results page:
Too early to call. The test has not yet cleared the minimums above, so no reliable verdict is available. The banner tells you to check back once more data has accumulated.
No clear winner. No variation has separated from the control.
Too close to call between the leaders. Two or more variations beat the control, but the difference between them is too small to separate. Either is a reasonable choice. Compare their performance on your success metrics to decide.
Clear winner. One variation has at least a 95% probability of beating every other variation in the test. The winner can be a challenger or the control — a test that confirms your current experience is a valid and useful result.
Interpreting the results page
Verdict and time remaining. The current state, and an estimate of how many days remain while the test is still collecting data.
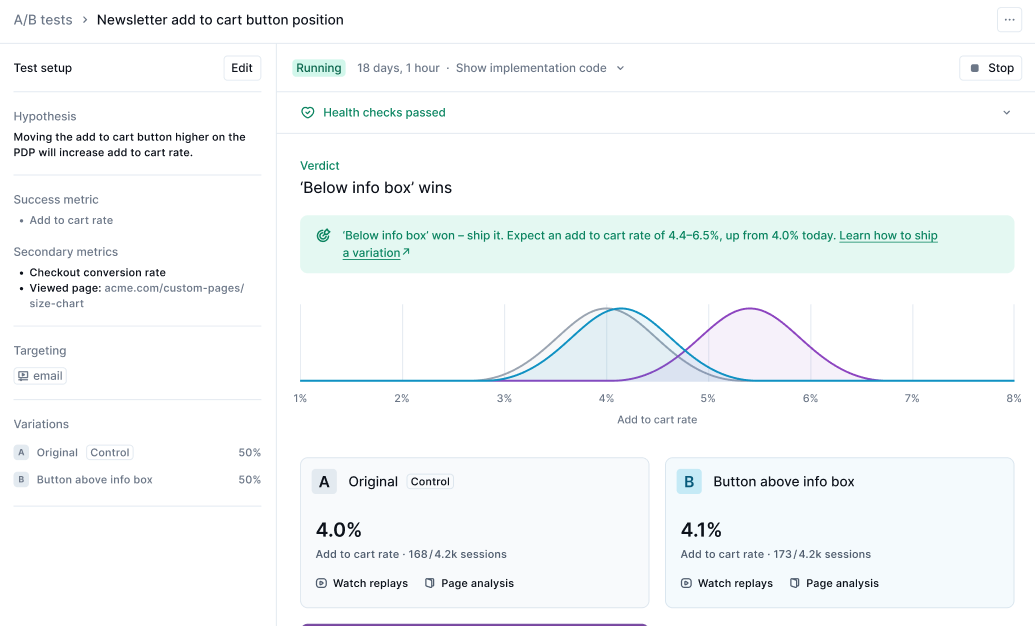
Results chart. A curve for each variation showing the range of plausible values for its true rate on the primary metric. The more the curves overlap, the less certain the comparison. Two curves sitting almost on top of each other is the visual form of “too close to call.”
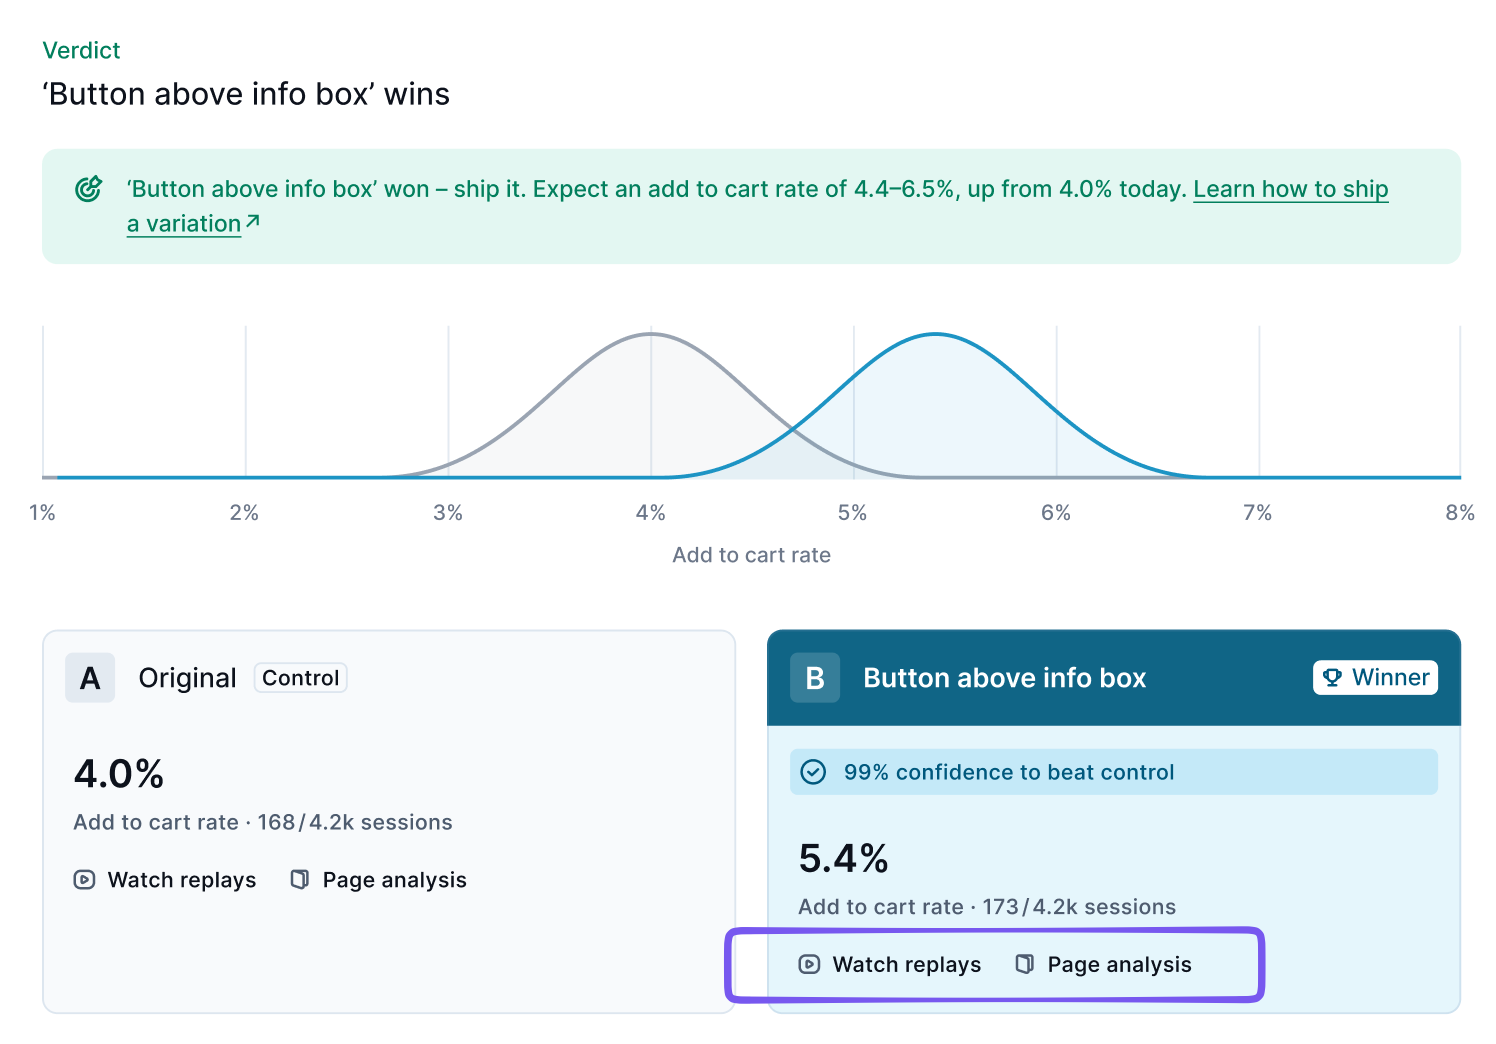
Variation cards. One card per variation, showing its primary-metric rate, its conversions and sessions (for example, “21 / 416 sessions”), and shortcuts to Watch replays and Page analysis filtered to that variation. The control carries a Control chip. A green checkmark means that variation beats the control, and the winner carries a winner badge. Any number of variations can beat the control, but only one can be the winner.
Advanced analytics. A table with the detailed numbers behind the verdict:
Probability to beat control — the chance this variation truly performs better than the control. A variation needs 95% or higher, with minimal expected loss, to be declared better than the control.
Probability to be best — the chance this variation is the single best performer in the test. These values add up to 100% across all variations.
Potential loss — roughly how much of the metric you would risk giving up if you shipped this variation and it turned out not to be the best. Lower is better. This is the figure that separates a safe call from a marginal one: a variation can lead on probability while still carrying enough potential loss to be worth waiting on.
Health checks
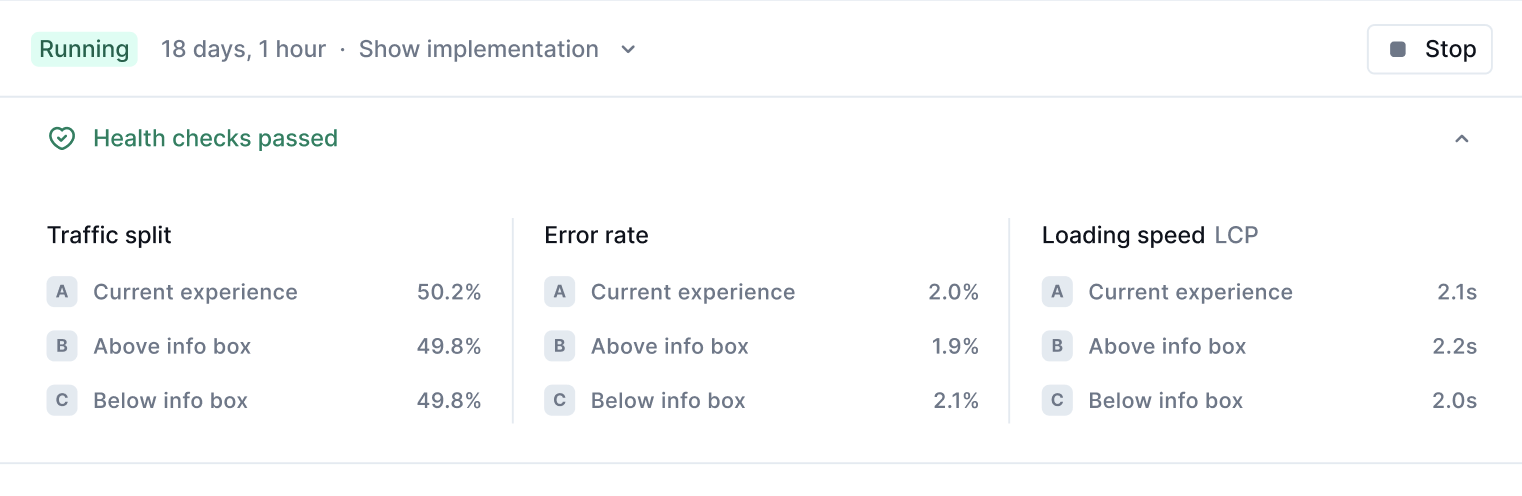
Health checks are automatic technical checks that run on every test. You do not configure them. They stay visible on the results page and show “all clear” when a test is healthy, so you can see that a result is safe to act on:
Error rate — warns when one variation’s rate of priority issues is meaningfully higher than another’s.
Page speed — warns when one variation’s page load time (P95 largest contentful paint) is noticeably slower than another’s.
Traffic split check — warns when the traffic actually reaching each variation drifts from the split you configured, which usually indicates a delivery problem. Elsewhere in the industry this check is known as a sample ratio mismatch check.
Health checks exist because a variation can lose for a technical reason rather than a design one. A variation that throws JavaScript errors in one browser, or that loads noticeably slower than the control, will underperform regardless of whether the idea behind it was sound. Without that signal, a broken variation looks like a rejected hypothesis, and a good idea gets discarded.
A triggered traffic split check is worth treating differently from the other two. It usually points at the implementation rather than the experience: a variation whose code is not live, a targeting rule interacting with the split in an unexpected way, or a flag read that is failing and falling through to the control.
Note: A triggered health check is a warning only. It never stops a test or prevents a winner from being declared. You stay in control of the decision.
Investigating a result
A result tells you what happened. The rest of Noibu tells you why. Because the A/B testing SDK uses the same browser and session identifiers as the Noibu script, every session in a test is already joined to the behavioural and technical data Noibu collects. No extra instrumentation is needed, and no export is involved.
Watch session replays for one variation
From a variation card, click Watch replays to see the sessions of visitors who were served that variation. This is the fastest way to turn a number into an explanation: you can see where visitors hesitated, what they clicked instead, and whether the change behaved as you intended.
Noibu records every session with no sampling and no quota. This matters most for narrowly targeted tests and uneven traffic splits, where a small arm might otherwise fall outside a sampled data set entirely. The replays for a variation receiving 10% of a targeted audience are all available.
Compare behaviour in Page analysis
From a variation card, click Page analysis to review that variation’s page data, including heatmaps. Comparing arms side by side shows you how interaction patterns differed — whether visitors scrolled further, engaged with a moved element, or ignored it.
This is how you distinguish two explanations that produce the same conversion number. A higher rate on a variation might mean visitors found the new layout easier, or it might mean they skipped an element entirely and converted for an unrelated reason. The conversion rate alone cannot tell you which; the behavioural data can.
Query test data through MCP
Test data is available through Noibu’s Model Context Protocol (MCP) server, so you can analyze results in AI tools such as Claude. This is useful for segmentation the results page does not present directly — for example, examining how a variation performed for one device type, traffic source, or geography — without exporting anything.
Deciding and ending the test
Noibu informs the decision but does not automatically stop a test, and it does not make any change permanent in your codebase.
You can stop a test at any time, including before it reaches a verdict. Stop early if a variation is causing genuine customer or business harm.
Let a test reach its verdict before you act on it otherwise. Acting on a leading-but-unresolved result is the most common way teams ship a change that does not hold.
Check the health checks before you accept a surprising result. An unexpected loss deserves a second look whenever an error rate or page speed warning is showing.
Once you have decided, stop the test in Noibu. Your development team then implements the winning variation directly in your site code and removes the test code. See the test lifecycle section in Implementing an A/B test.
Record what you learned, including from tests with no clear winner. A test that fails to separate still tells you that the change you made does not move the metric you chose, which is worth knowing before anyone proposes it again.