Working with Noibu in Claude
Last updated: July 15, 2026
The Noibu plugin for Claude turns common ecommerce analysis questions into structured, repeatable workflows. It ships with a set of pre-built skills — packaged instructions to produce a specific kind of output, such as a ranked list of opportunities, a checkout funnel chart, or the root cause of a priority error. Alongside the skills, you can ask Claude any ad-hoc question about your store and it will query Noibu directly.
This article covers the skills included in the plugin, with real merchant examples of how they're being used.
Ecommerce skills included in the plugin
Skills are useful when you want a deep, more structured analysis than a single question would produce, or when you want a result you can save, schedule, or share with your team. You can trigger a skill in three ways:
Ask a question that matches the skill's purpose. Claude detects and runs the appropriate skill (for example, "where are people dropping off in checkout?" triggers the Checkout Analysis skill).
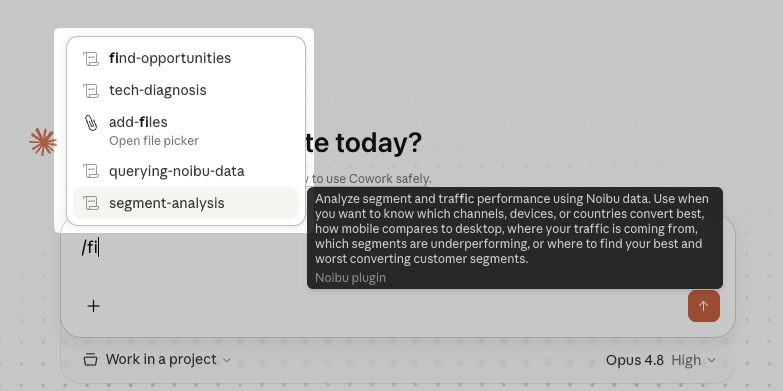
Type the skill name as a slash command. For example, /store-pulse or /product-analysis
Ask Claude to run a specific skill. For example, "run a full segment analysis."
Important: Switch to Cowork mode before using skills to get the best results.
Store Pulse
What it does: Gives you a live, at-a-glance overview of your store's health, presented as a Live Artifact that tracks your key ecommerce metrics. Use it to check overall store performance, customize what the dashboard tracks, or set up a recurring summary.

When to use it: First thing in the morning, before a leadership update, or any time you want a quick read on how the store is doing. Power users also use this skill to stand up a shared, always-current dashboard the rest of the team can open without asking a question.
How to trigger it: Ask "how is my store doing today?", "give me a store overview", or type /store-pulse.
What you get: A live dashboard artifact tracking conversion rate, revenue, sessions, and other core metrics for your selected time window. The artifact can be reopened later and refreshed against current data.
Real merchant use-case: A DTC accessories brand turned a weekly manual product-performance report into a live dashboard any team member can open at any time. The team refreshes the artifact on demand instead of waiting for a weekly report cycle.
Checkout Analysis
What it does: Analyzes checkout performance and health. Surfaces where shoppers drop off in the checkout funnel, what payment and delivery methods customers are using, why completion rates are low, what priority errors are hurting checkout, and how cart and order values benchmark against your norms.

When to use it: When you suspect checkout friction, after a checkout change you want to validate, or when conversion rate moves and you need to know why. A common pattern is a soft revenue day that prompts a funnel-depth check and an error check in the same conversation — this skill covers both.
How to trigger it: Ask "where are people dropping off in checkout?", "are there errors on my checkout pages?", "what payment methods are customers using?", or type /checkout-analysis.
What you get: A broad overview (full funnel by depth, cart and order value baseline, payment method mix, delivery method mix, and any priority errors on checkout pages) followed by targeted follow-ups on the most interesting signals. The final report leads with 3 key findings paired with recommended actions.
Real merchant use-case: A specialty tools retailer quantified cart-abandonment leakage in revenue terms to build the business case for an express checkout investment. The full-funnel view showed exactly which step was leaking the most value.
Segment Analysis
What it does: Analyzes segment and traffic performance. Surfaces which channels, devices, or countries convert best, how mobile compares to desktop, where your traffic is coming from, and which segments are underperforming.

When to use it: When you want to understand who's converting and who isn't, when channel performance shifts, when you're allocating budget across markets, or when you need to know whether a problem is universal or concentrated in one segment (for example, worse on mobile, or specific to one country).
How to trigger it: Ask "which channel converts best?", "how does mobile compare to desktop?", "which countries are underperforming?", or type /segment-analysis.
Important: For marketing channels, this skill reports on-site behaviour from Noibu's own data — sessions, conversion rate, and revenue by UTM source, medium, and campaign. To bring ad-platform spend metrics such as cost, ROAS, or CPC into the same conversation to analyze, connect the relevant ad platform through Claude's own connector marketplace.
What you get: A broad overview across device, country, and marketing channel — each with a table and a specific insight callout — followed by targeted follow-ups on the most interesting signals (campaign breakdowns, landing page breakdowns, or funnel stage breakdowns by segment).
Real merchant use-case: One luxury accessories merchant found paid social converting at half the rate of organic on mobile and used the finding to redesign a landing page mid-campaign. The device × channel cut surfaced a gap that channel-level reporting alone had missed.
Product Analysis
What it does: Analyzes product and collection performance. Surfaces which products are underperforming, what your best-selling product type is, why a specific product isn't converting, how collections are performing, which products get views but no sales, and where shoppers drop off in the product funnel.

When to use it: Before merchandising decisions, after a product page redesign, when a specific product or collection feels off, or when planning a seasonal promotion and you need to find candidate products with strong customer interest.
How to trigger it: Ask "which products are underperforming?", "how is the Sale collection performing?", "why isn't my polo converting?", or type /product-analysis.
What you get: A broad overview across products, collections, and product types — views, add-to-carts, purchases, conversion rate, and revenue per session — followed by targeted follow-ups on the most interesting signals.
Real merchant use-case: An accessories brand identified high-exit PDPs by scroll depth and exit rate and redirected promotional focus toward pages with suppressed conversion. The result reshaped the next merchandising cycle.
Tech Diagnosis
What it does: Investigates technical issues and performance problems using Noibu data. Run it as a store-wide analysis to surface the most impactful fixes, or point it at a specific priority error, symptom, or slow page. The skill summarizes the issue, traces the likely cause across real sessions, errors, and performance data, and recommends a fix — covering JavaScript errors, failed requests, checkout-blocking bugs, and Core Web Vitals. You can also schedule it to run automatically, pushing fixes or opening tickets without manual intervention.

When to use it: When a priority error is hurting checkout or conversion, when you need to confirm a fix landed after a deploy, when a page is loading slowly or a regression appeared after an app or theme change, or when you need to scope an issue clearly enough to escalate it to engineering. Run it before and after a deploy to verify a regression cleared, or put it on a schedule to continuously monitor your store and act on new issues automatically.
How to trigger it: Ask "what's the root cause of issue #299?", "is this checkout error still active after my deploy?", "which pages are slowest, and on which devices?", "did my CLS regression clear up?", "run a full store analysis and fix what you find", or type /tech-diagnosis.
What you get: A structured diagnosis covering the issue summary, supporting evidence (affected sessions, error detail, and performance metrics), the most likely cause, and a recommended fix. When you're ready to act, the skill can push a fix (GitHub connection required), open a ticket in Linear, Jira, or Notion, or package the diagnosis as a shareable report — and on a schedule, it can do all of this automatically as new issues emerge.
Real merchant use-case: A homewares brand cut bug diagnosis from days to under an hour and confirmed a fix landed before the next sale period. Maker House, a home goods brand, uses the same skill on the performance side — confirming a deploy fixed a 1.4-second LCP regression on top category pages before a promotional window opened.
Saving, sharing, and scheduling
After an analysis runs, Claude offers a few ways to keep the result:
Live dashboard. A persistent artifact in Cowork that you can reopen any time. The artifact re-runs the underlying queries each time you open it, so the data stays current.
PDF report. A static export of the report at the time it was generated. Good for filing or sharing externally.
Slack or email. You can set up a recurring digest on a schedule of your choosing, with results sent directly to Slack or email.
Alternatively, you can ask Claude to set up a custom scheduled task that calls multiple skills — for example, a daily brief that pulls new priority errors, your conversion-rate pulse, and revenue versus the prior day, then delivers it to Slack, Notion, Google Drive, or your inbox each morning. This is a common way to get a structured "is anything wrong today?" summary pushed to you without opening a dashboard.
Real merchant use-case: A gaming and entertainment brand runs a morning brief that covers new priority errors in the last 24 hours, the conversion rate pulse, and revenue versus the prior day — assembled from multiple Noibu queries and delivered automatically before the team starts the day.
Other ways merchants use Noibu in Claude
Some of the most common merchant workflows aren't tied to a single pre-built skill — they combine ad-hoc queries with inline visualizations like session replay, click maps, and journey paths. A few patterns we see repeatedly:
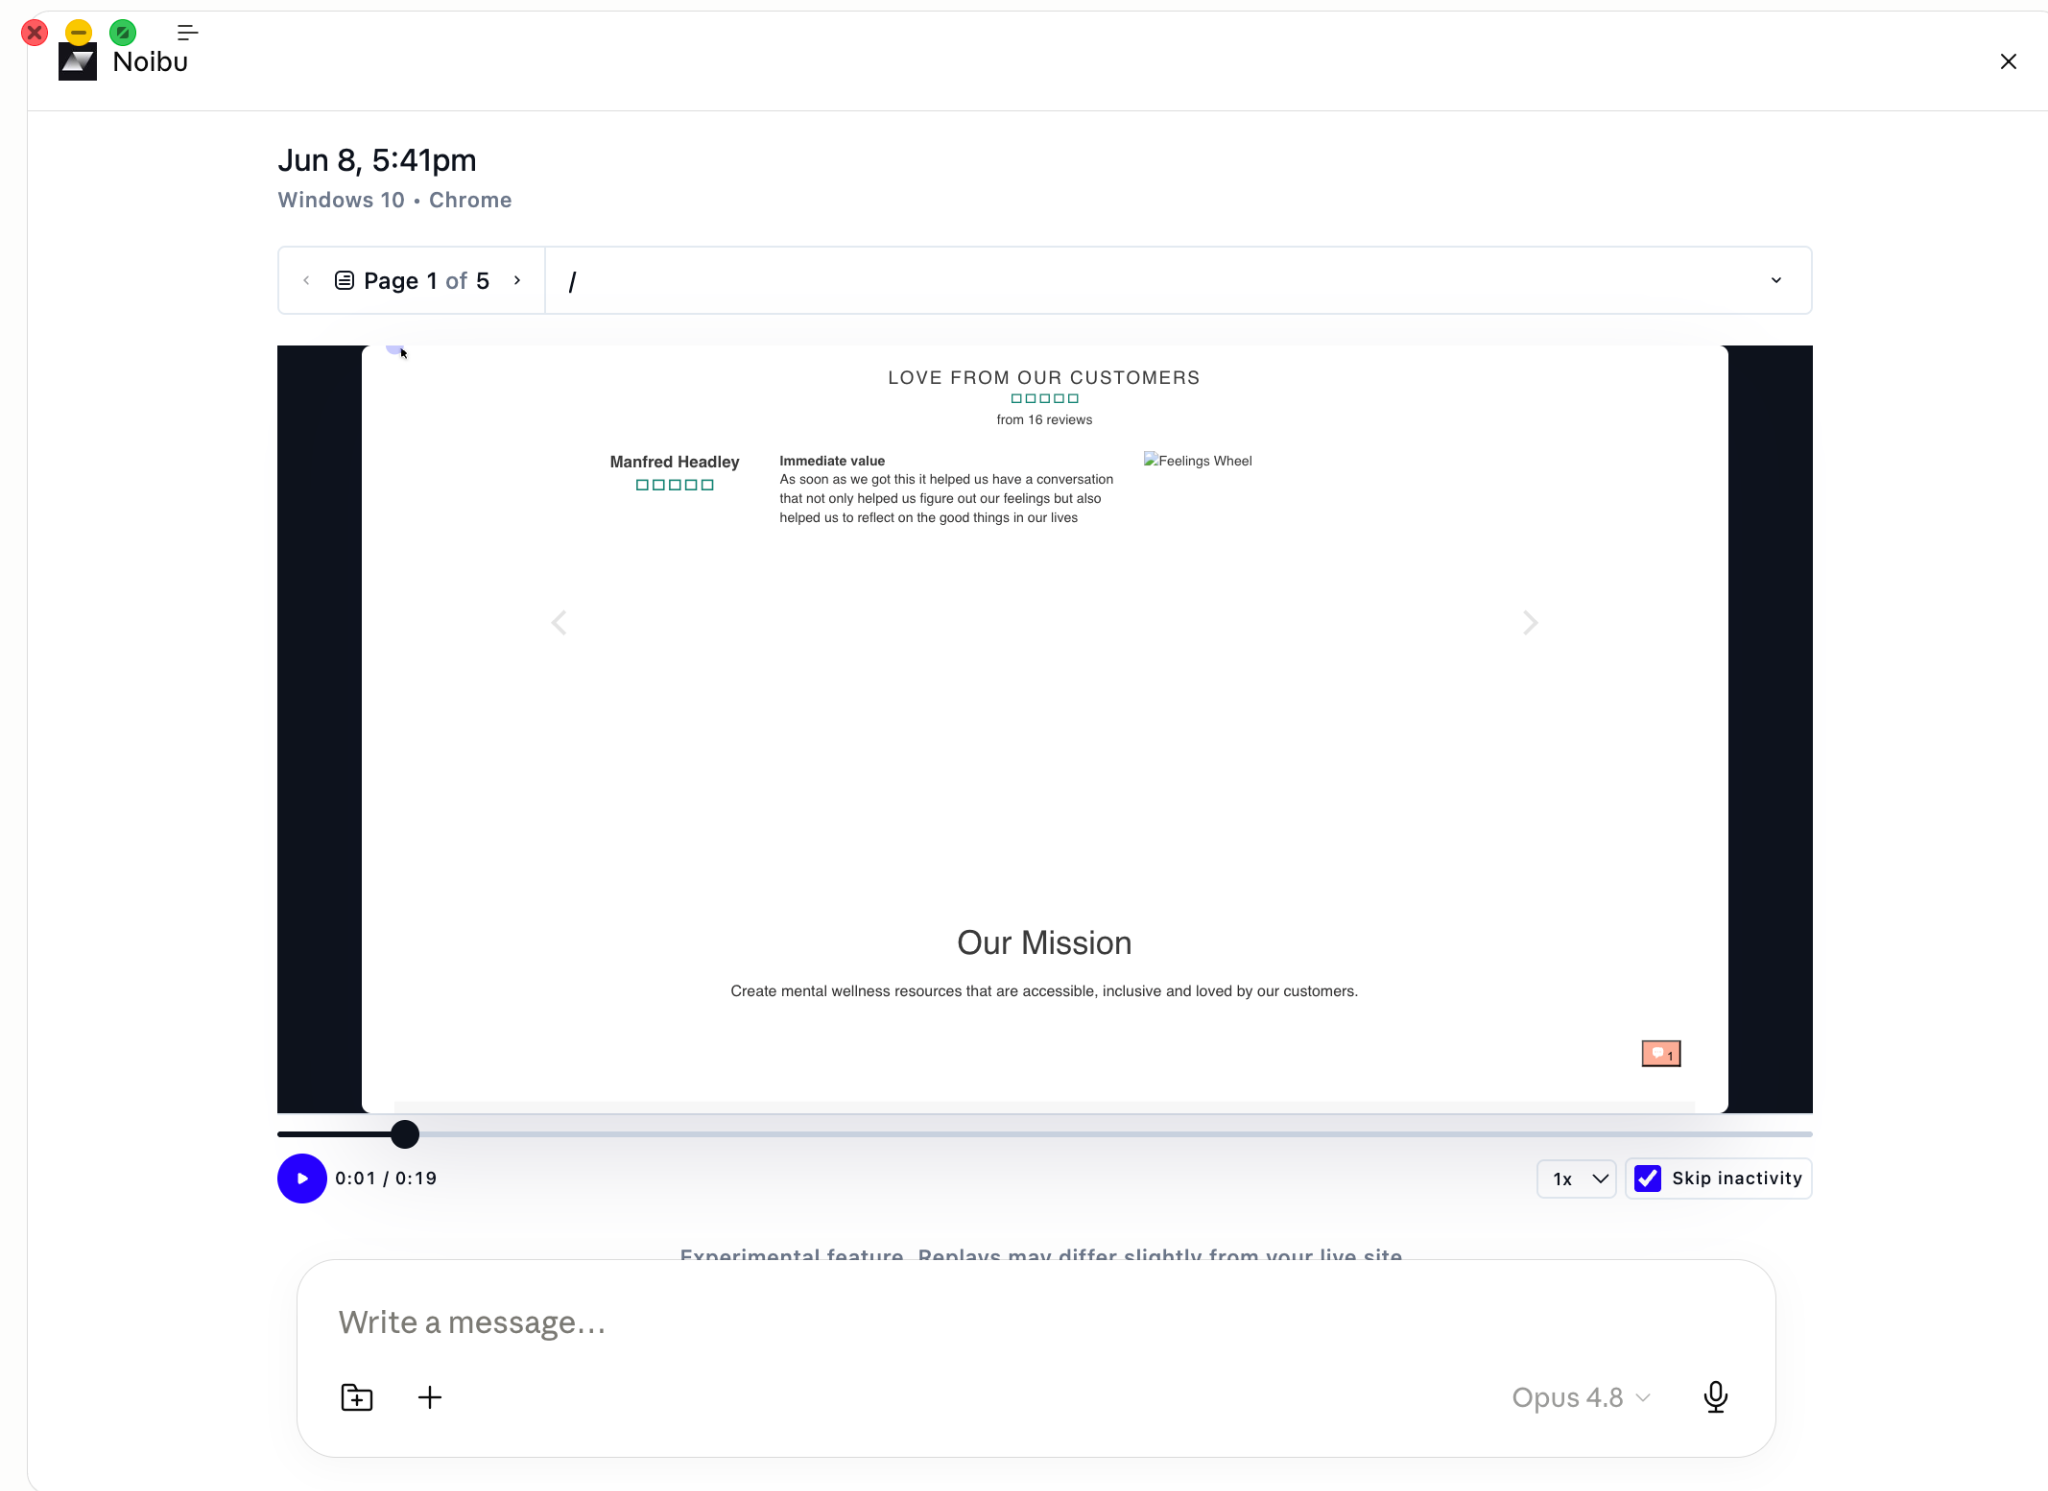
Watching session replays to confirm a hypothesis
After identifying a friction point or error in the data, merchants often want to see what actually happened in a specific session — to confirm a hypothesis or explain the failure to the team. One men's designer apparel brand found a repeating dead-zone interaction pattern by watching high-rage-click session replays inline that aggregate data alone had missed.
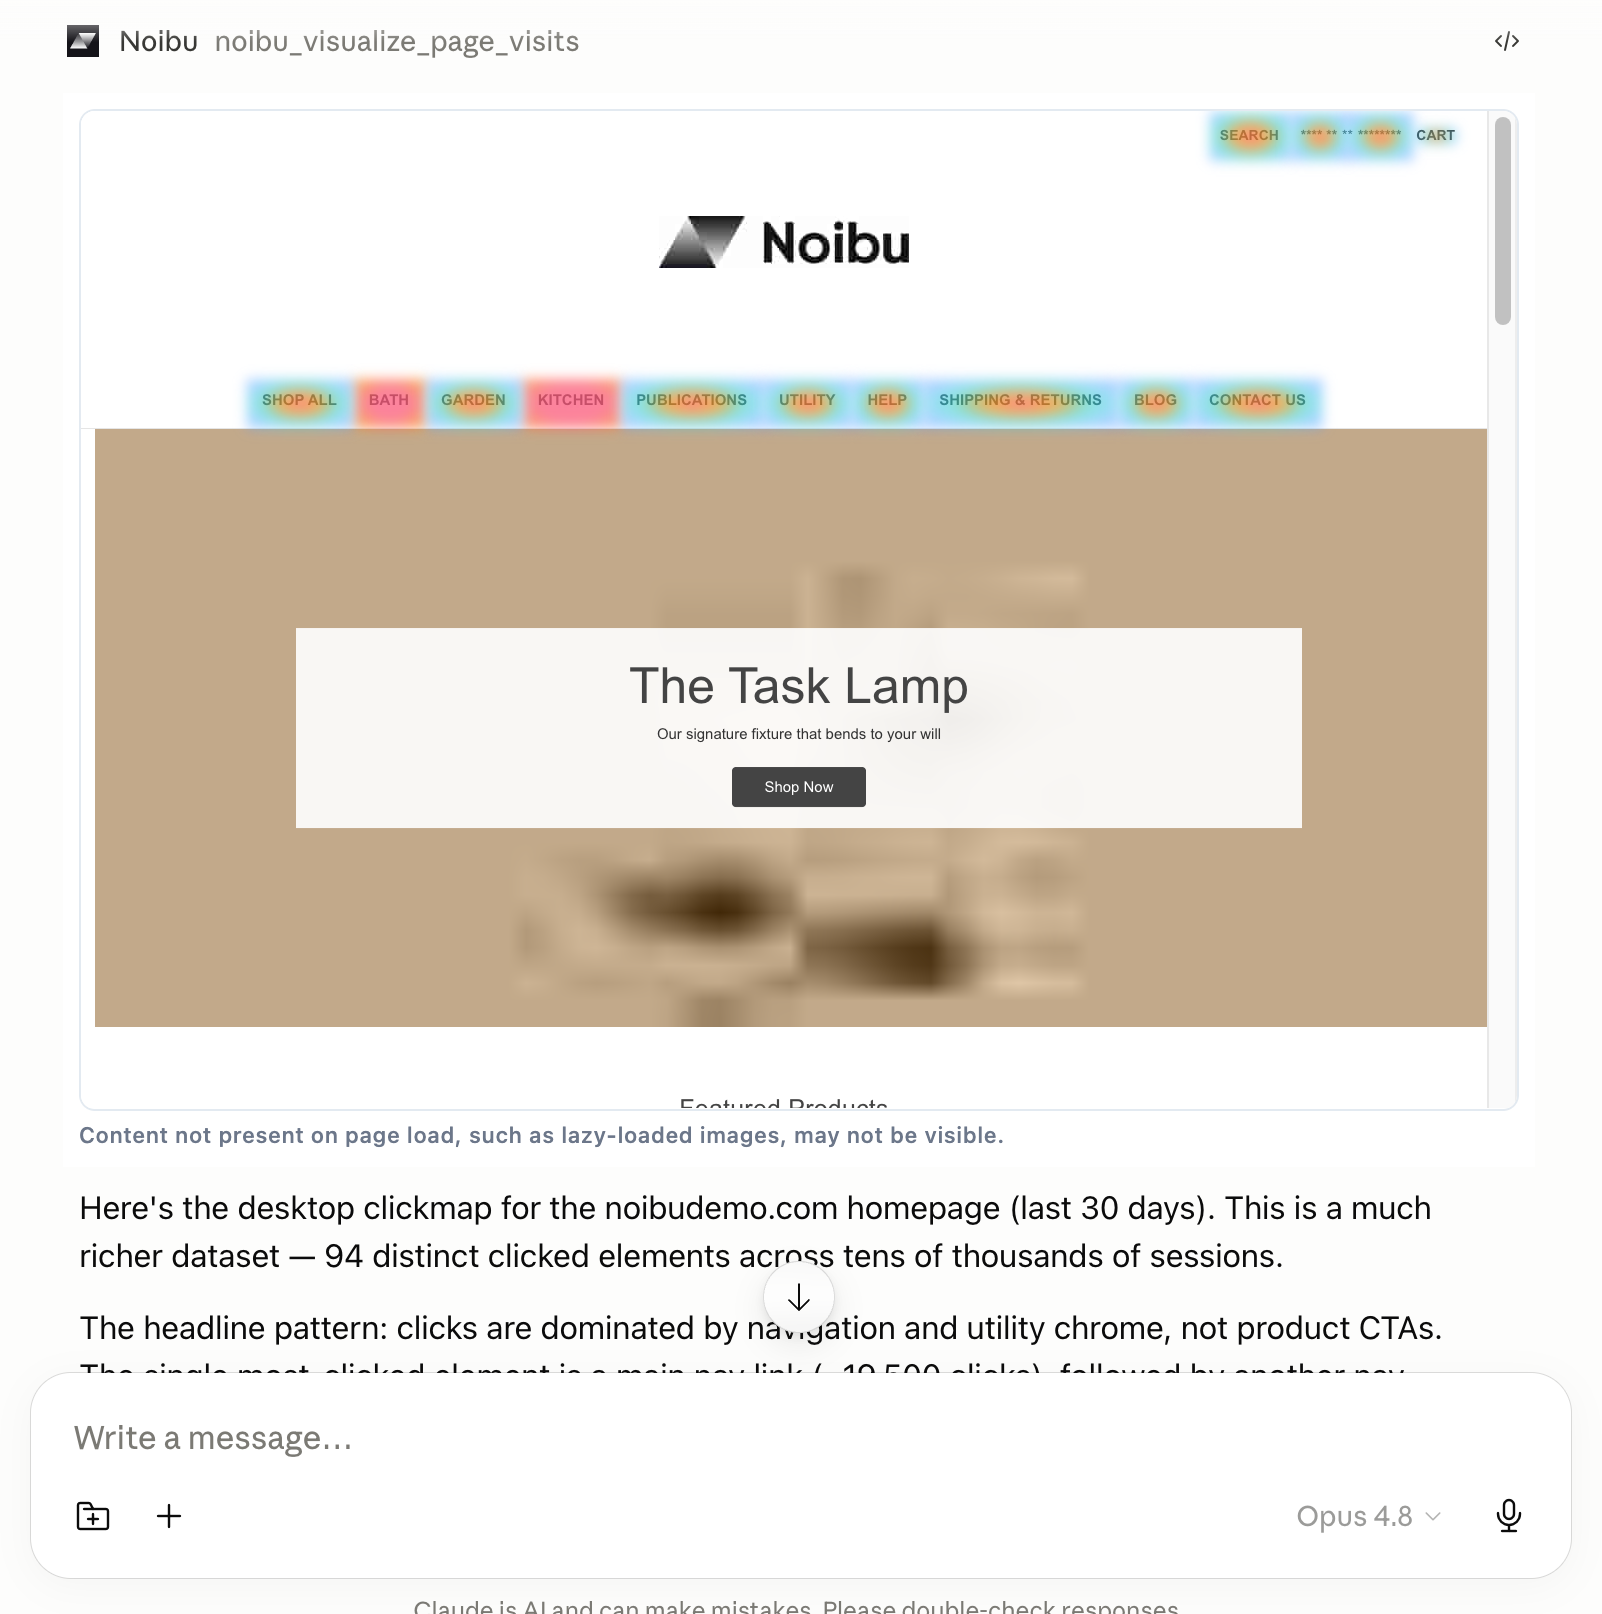
Mapping click and tap behaviour to inform design decisions
Merchants combine click-text analysis, dead-click identification, and page-group journey shapes to ground redesign decisions in what shoppers actually do. A specialty bridal retailer mapped real mobile CTA click patterns to inform a homepage redesign, surfacing a dead zone that accounted for most above-fold interactions.
Measuring AI assistant referral traffic
A small but growing group of merchants is starting to treat AI assistant referrals (ChatGPT, Perplexity, Claude, Gemini, Copilot) as a distinct traffic channel. They track AI assistant referral conversion rate as the foundation of a generative engine optimization (GEO) strategy, using ad-hoc UTM and referrer queries against Noibu's session data.