Overview of Issue Details
Last updated: March 19, 2026
From the Issues Table, you can dive into the details of any individual issue to better understand the nature of the problem and its impact to your business.

Issue Title and Insights
At the top of this page you’ll see the issue ID and an AI-determination of the issue’s Conversion Impact. Beneath the AI-generated error title and technical error message, you’ll see any applicable Issue Insights, which indicate recurring trends associated with the issue’s occurrence.
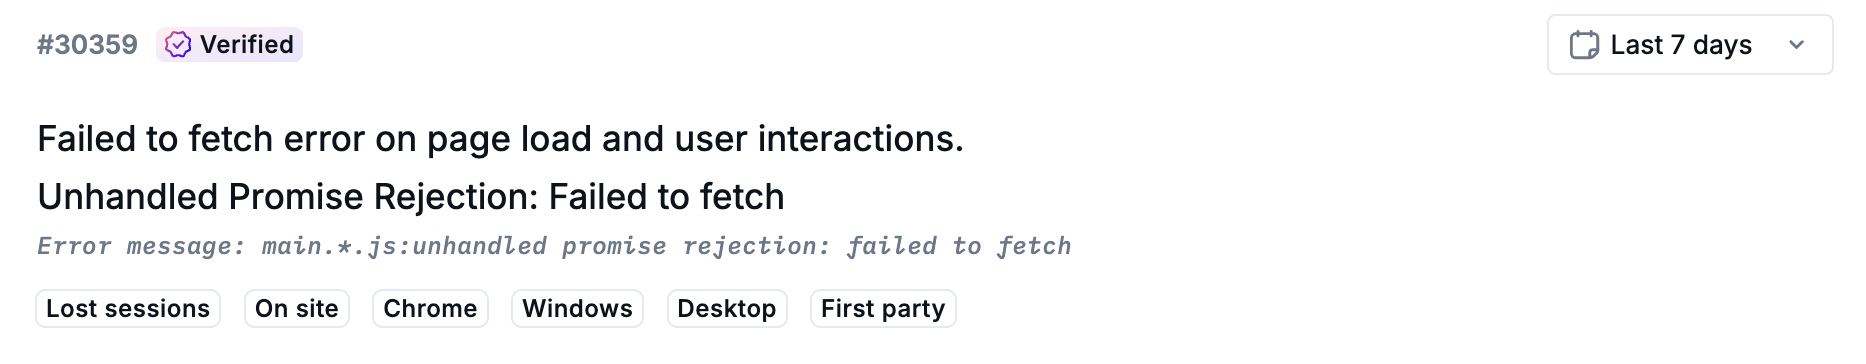
Hovering over any Insight indicator shows a brief definition of that Insight. Scrolling further down the page provides additional details on specific error types.
Sessions & Occurrences Chart
The Sessions chart displays the number of sessions impacted by the issue over the period of time selected (last 1, 7, 14, 30, and 90 days). It helps you understand the trajectory of an issue over time.
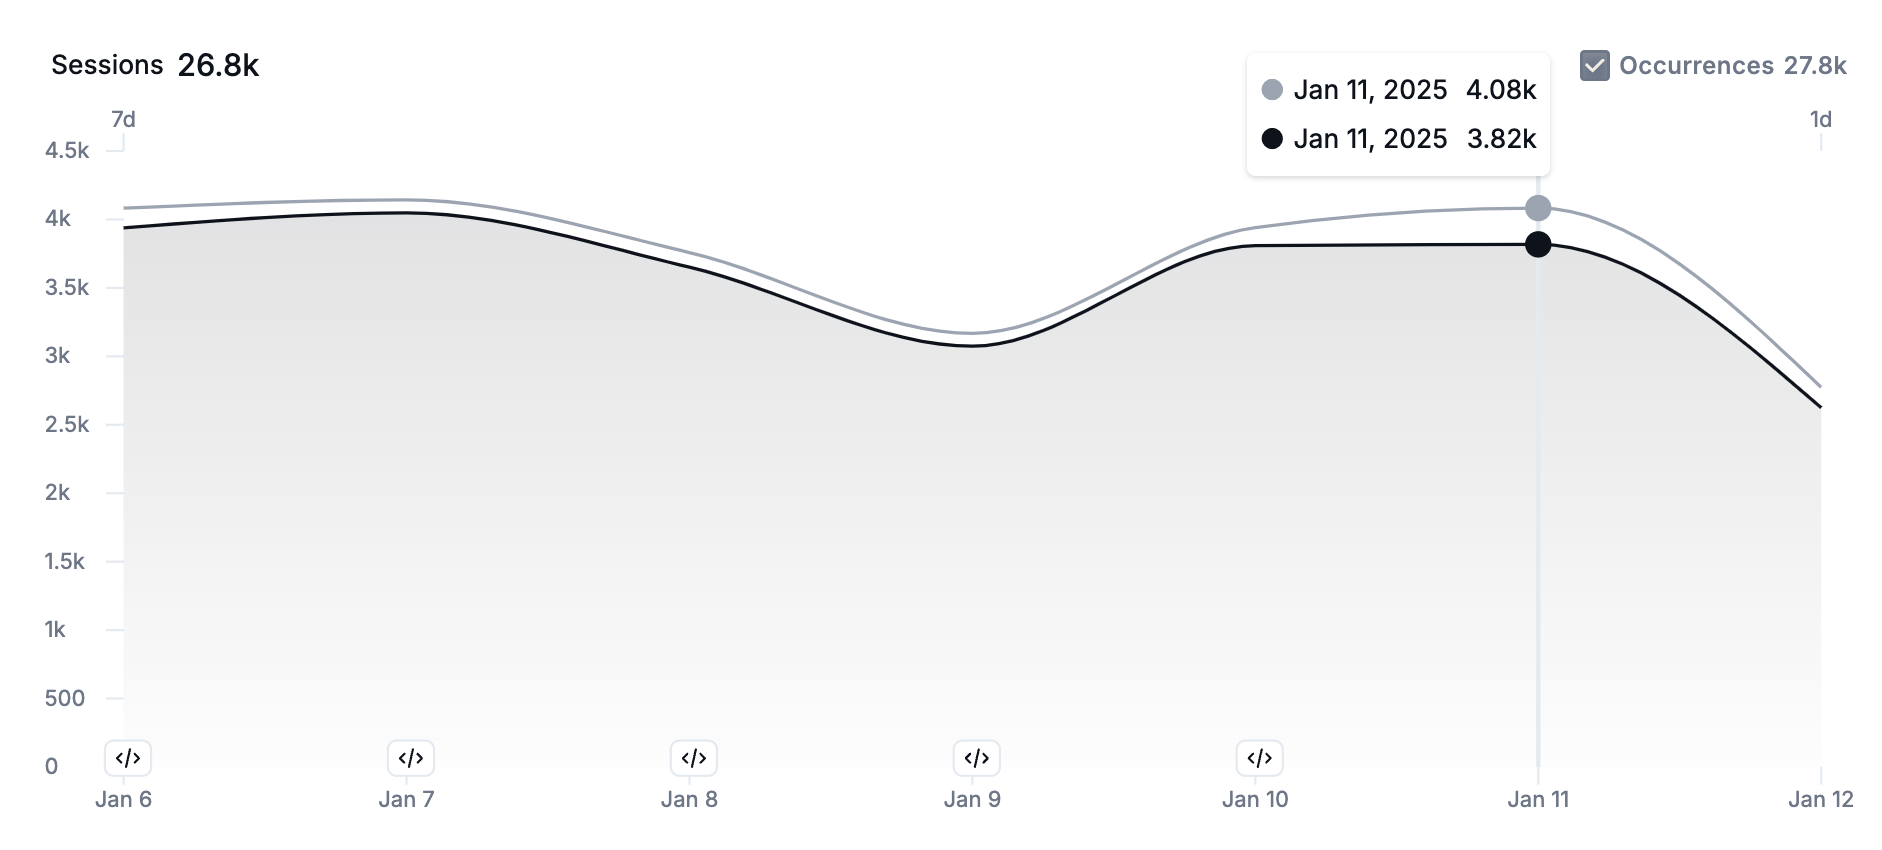
Enabling the Occurrences option will overlay occurrence trends over time as well, providing insight into the relationship between sessions and occurrences. Issues that occur frequently and consistently should be investigated before those that occur sporadically.
If applicable, release events will be indicated along the horizontal axis of this chart via a icon. Clicking the icon will show you a preview of release events that occurred on that date. Learn more about release events.
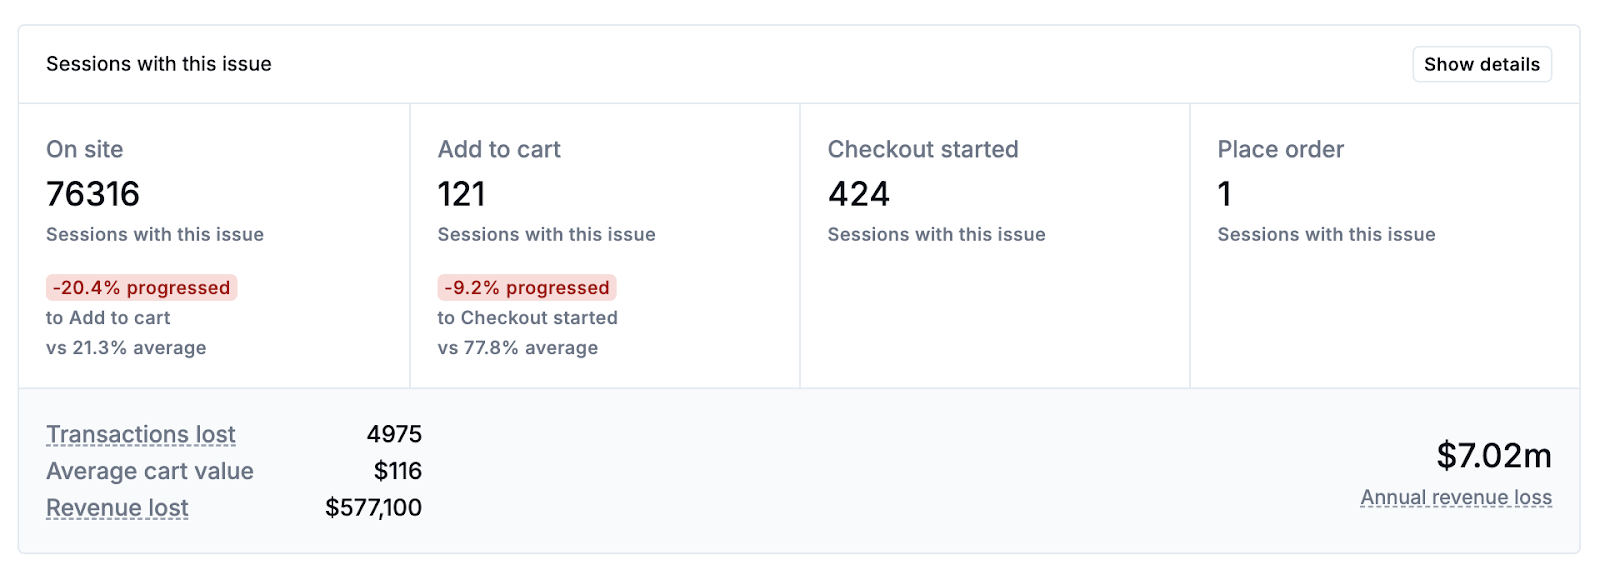
Funnel Impact table
The Funnel Impact section shows how the issue affected the purchase journey at each stage of the funnel. Clicking the ‘Show details’ button provides a detailed breakdown of impact. Learn more about funnel impact metrics.
Issue Details for Javascript Errors, HTTP Errors, and GraphQL Errors
Overview of Javascript Errors, HTTP Errors, and GraphQL Errors
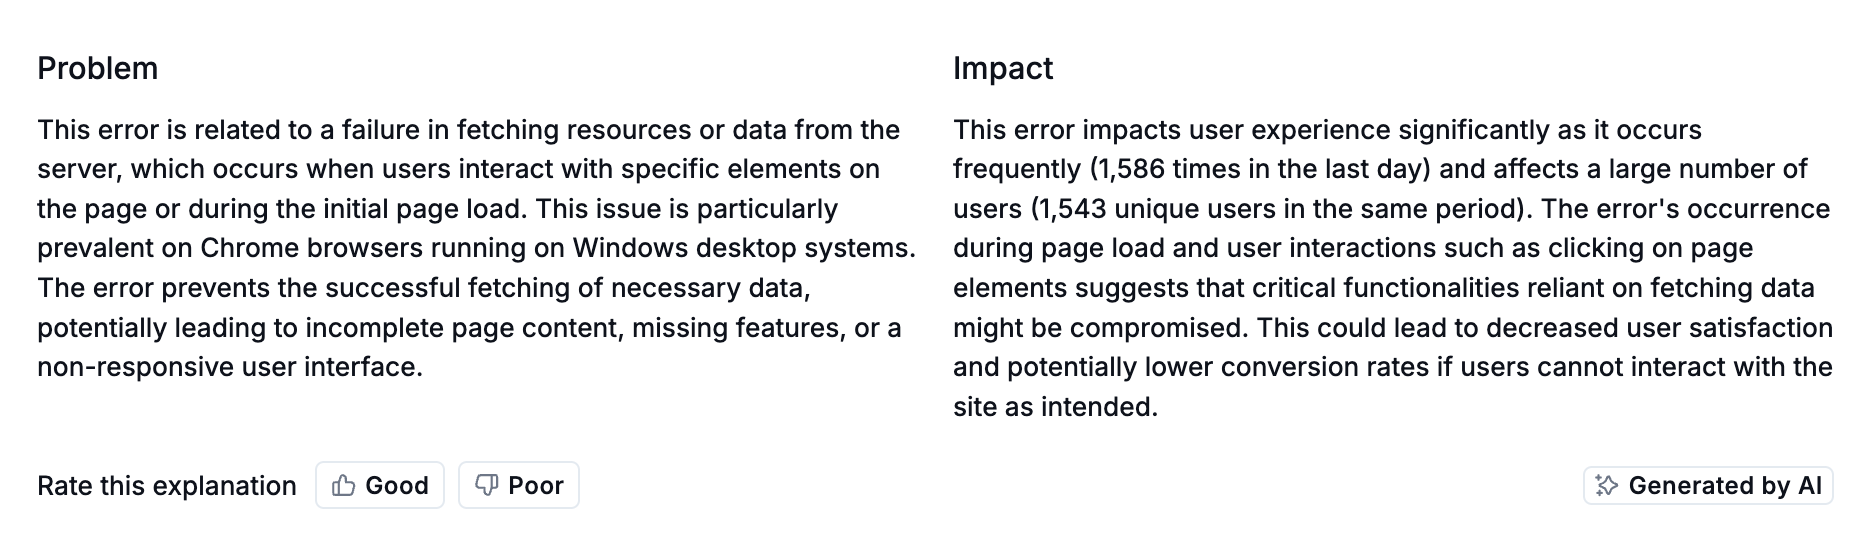
Under the error title, AI-generated explanations of the Problem and Impact provide an at-a-glance description of the problem. These succinct paragraphs bring clarity to the technical details underlying an individual issue so you can better evaluate the problem.
Session Highlights for Javascript Errors, HTTP Errors, and GraphQL Errors
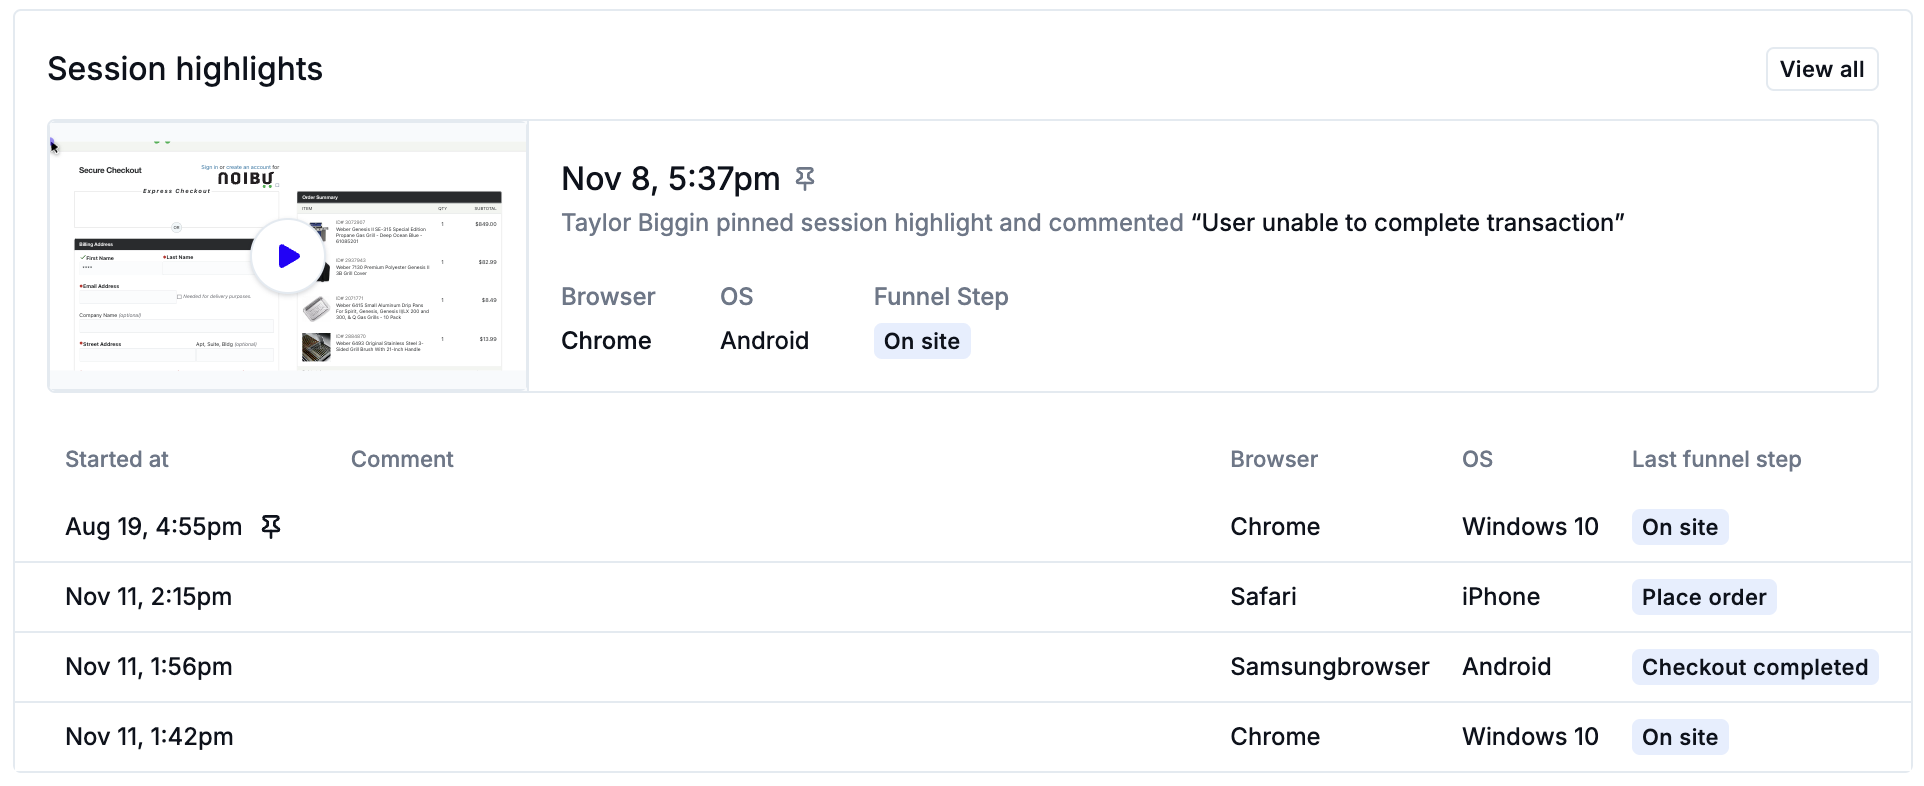
For JS, HTTP, and GQL errors, Noibu will display a selection of Session Highlights to provide additional context on how the issue impacted a user's experience on your site. Any pinned session highlights will be shown first in this list, followed by other session highlights.
Click on any row to view the session highlight. Learn more about session playback.
Issue Details for Image Errors
For issues specifically caused by images failing to load, you will see a preview of the page on which the image error occurs. A red dotted line indicates the broken image.
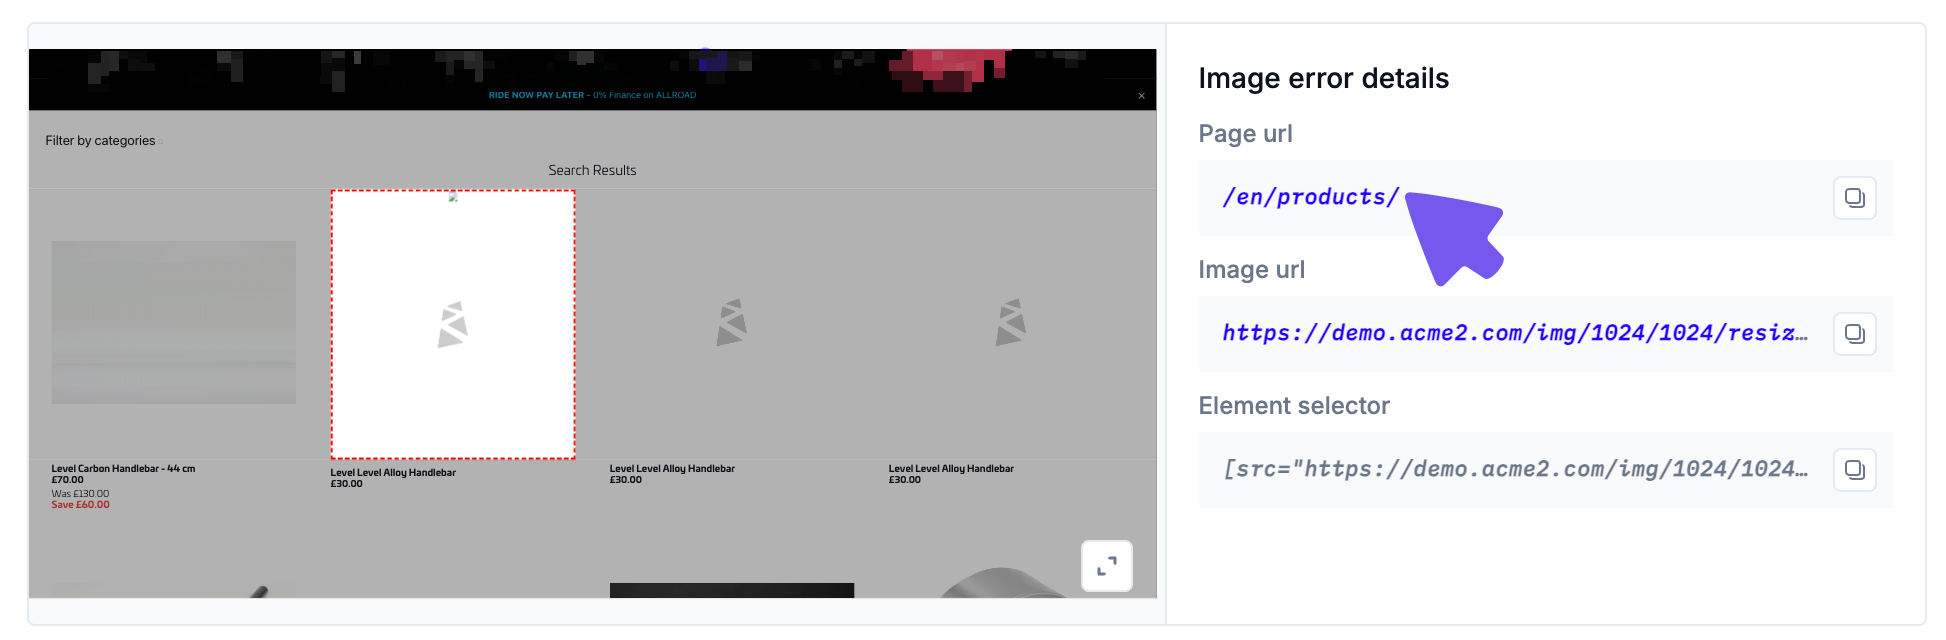
Noibu also provides further details about the image error to help technical teams investigate where the error occurs and how to fix it.
Page URL: the URL of a page on which the broken image occurs.
Clicking on this URL opens the page in a new tab, allowing you to find the exact location of where an image is failing to load.
A broken image can impact multiple pages. By referencing the Top URLs section further down the page, you can find other pages impacted by the broken image.
Image URL: the path to the image that failed to load.
This can provide helpful information about what image was supposed to load so teams can investigate further.
Clicking on this URL will open up a new tab to verify that the image is broken.
Element selector: the identifier in the webpage's code used to locate the image that failed to load.
Additional Issue Details
Scroll down to uncover further details about the potential impact of an issue to your business, as well as where and how it occurs. The other sections on this page include:
Top Symptoms: indicates prevalence of each session symptom associated with the issue. Learn more about Top Symptoms.
Top Pages: lists the URLs on the domain where the error has occurred at the highest frequency. Learn more about Top URLs.