Session Playback
Last updated: March 31, 2026
Session replays are essential for diagnosing errors in Noibu. A video of an error occurring gives unique insight into the customer experience, and may help you identify the step, field, button, or process that triggers the error. From there, you can examine your user logs and source code to uncover the error's cause.
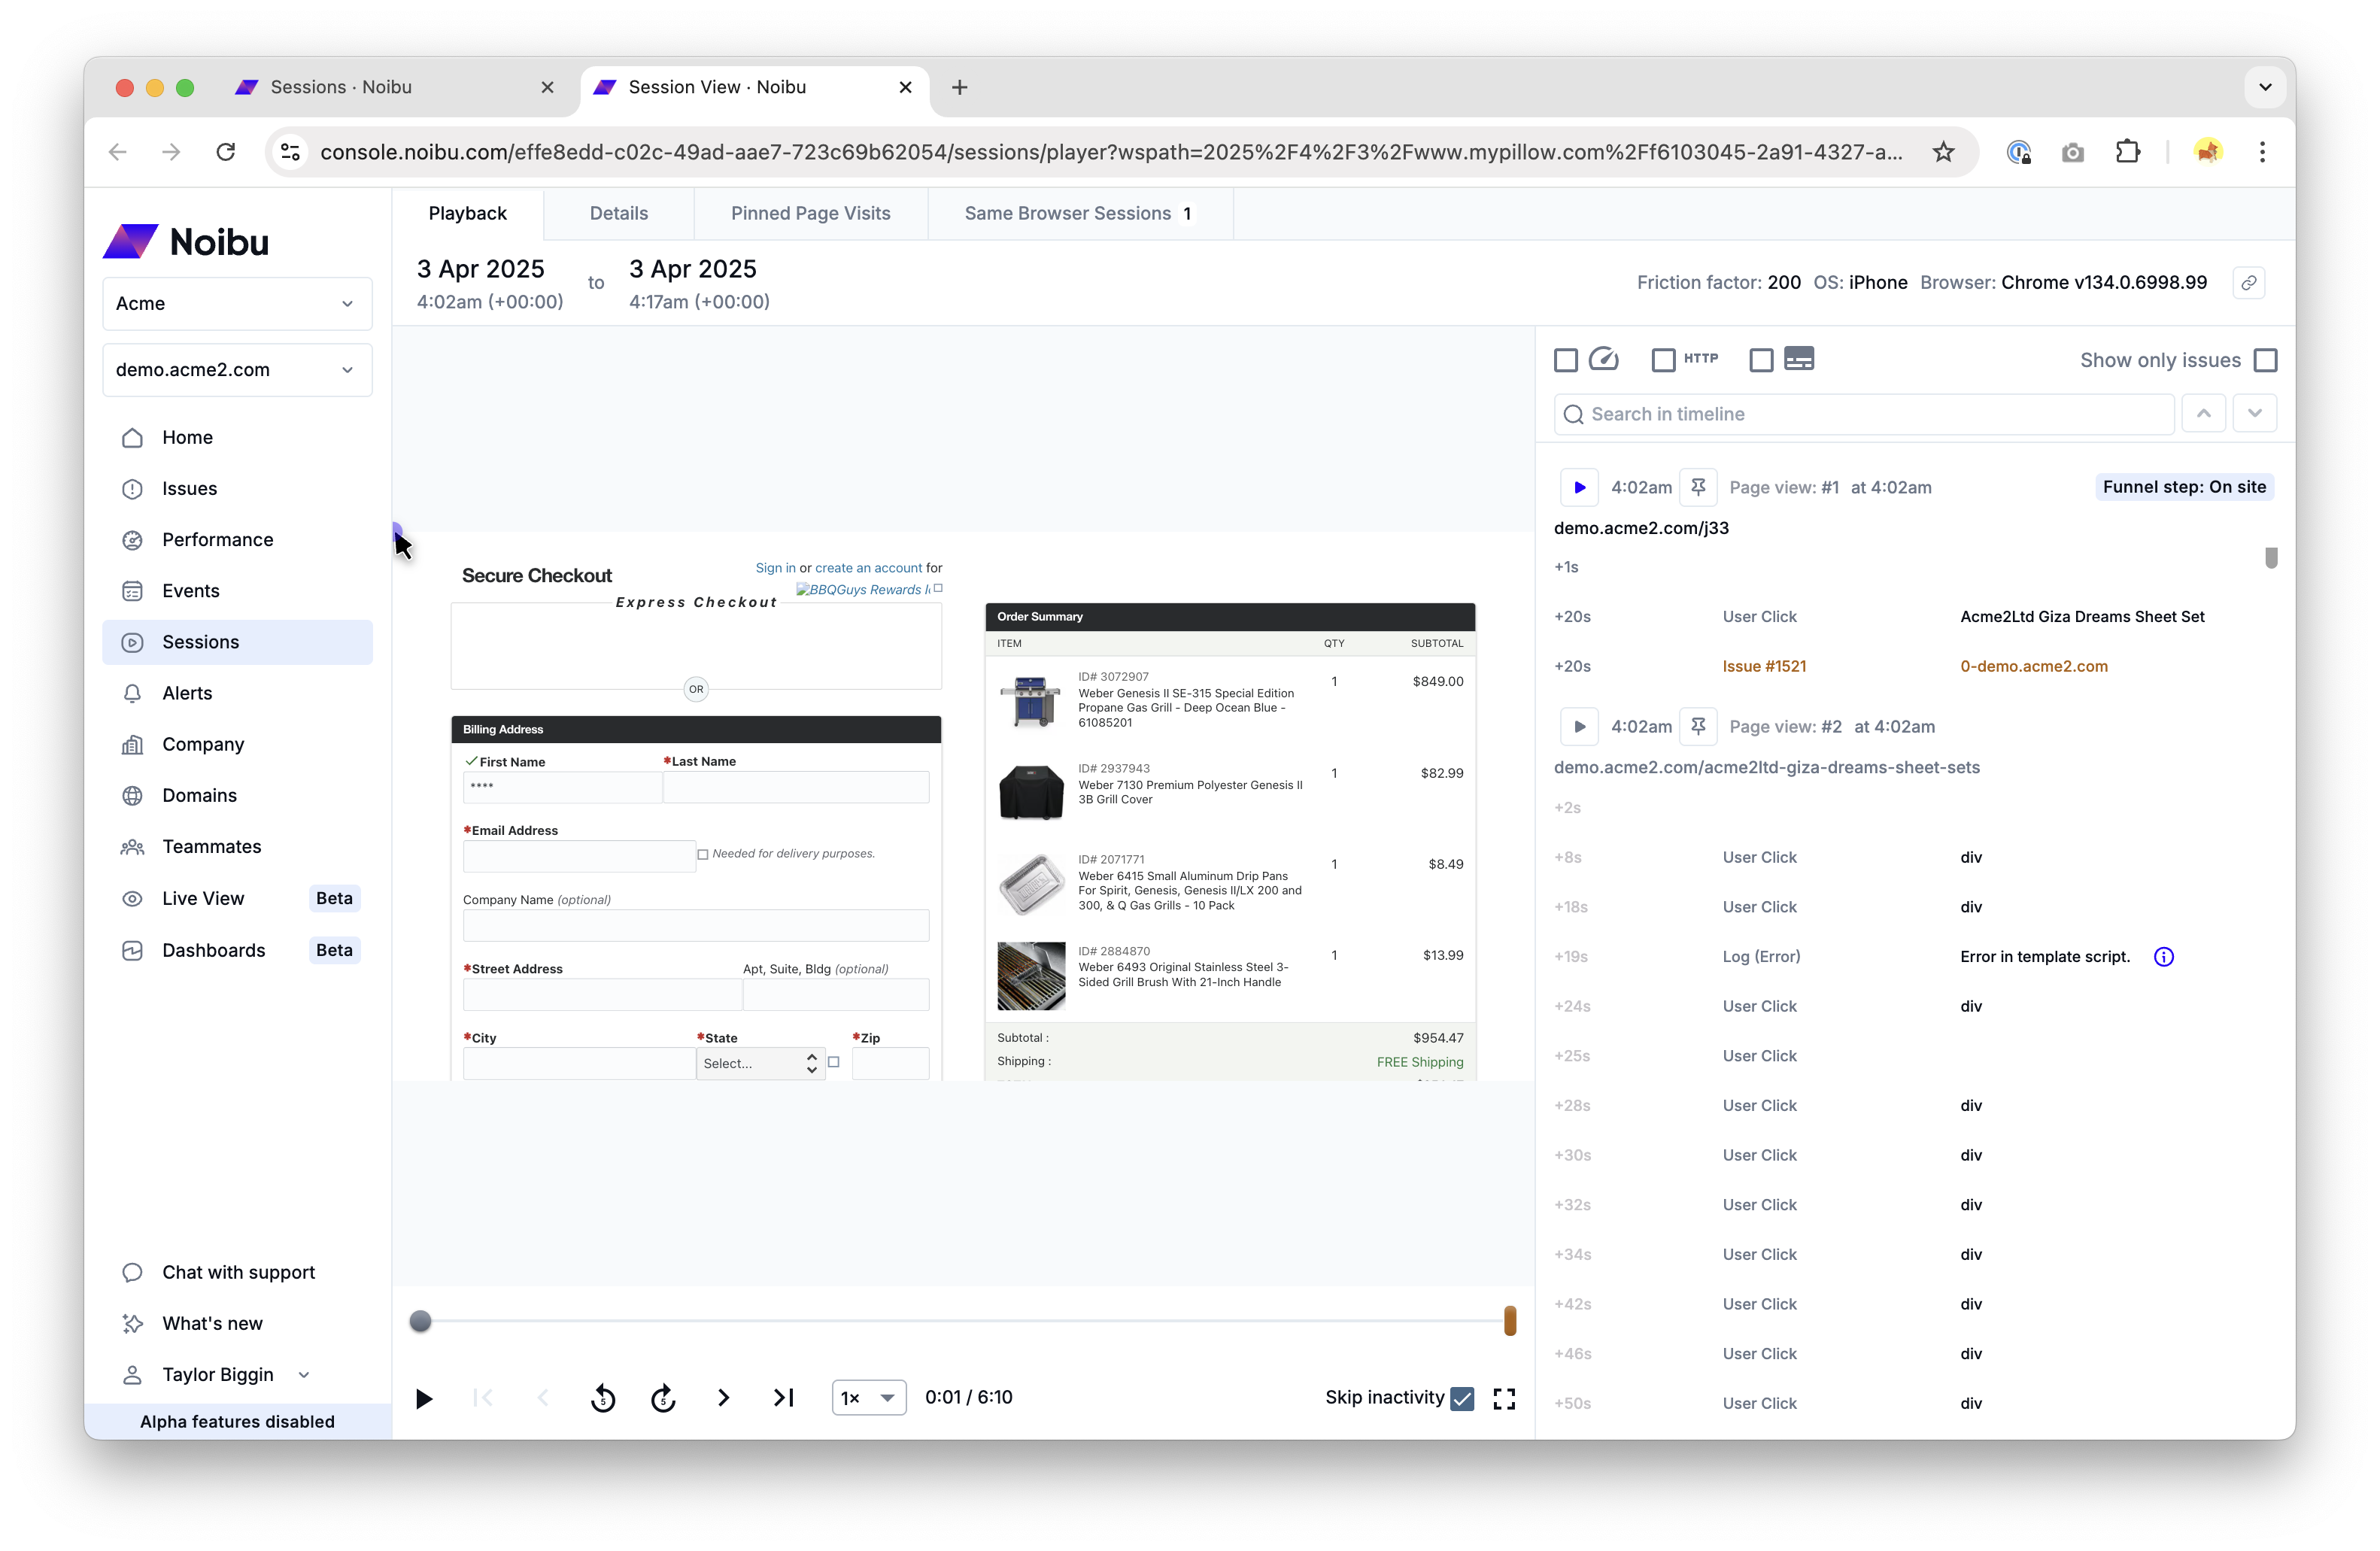
The Playback tab has two parts: the Session Player and the Session Timeline.
Session Player
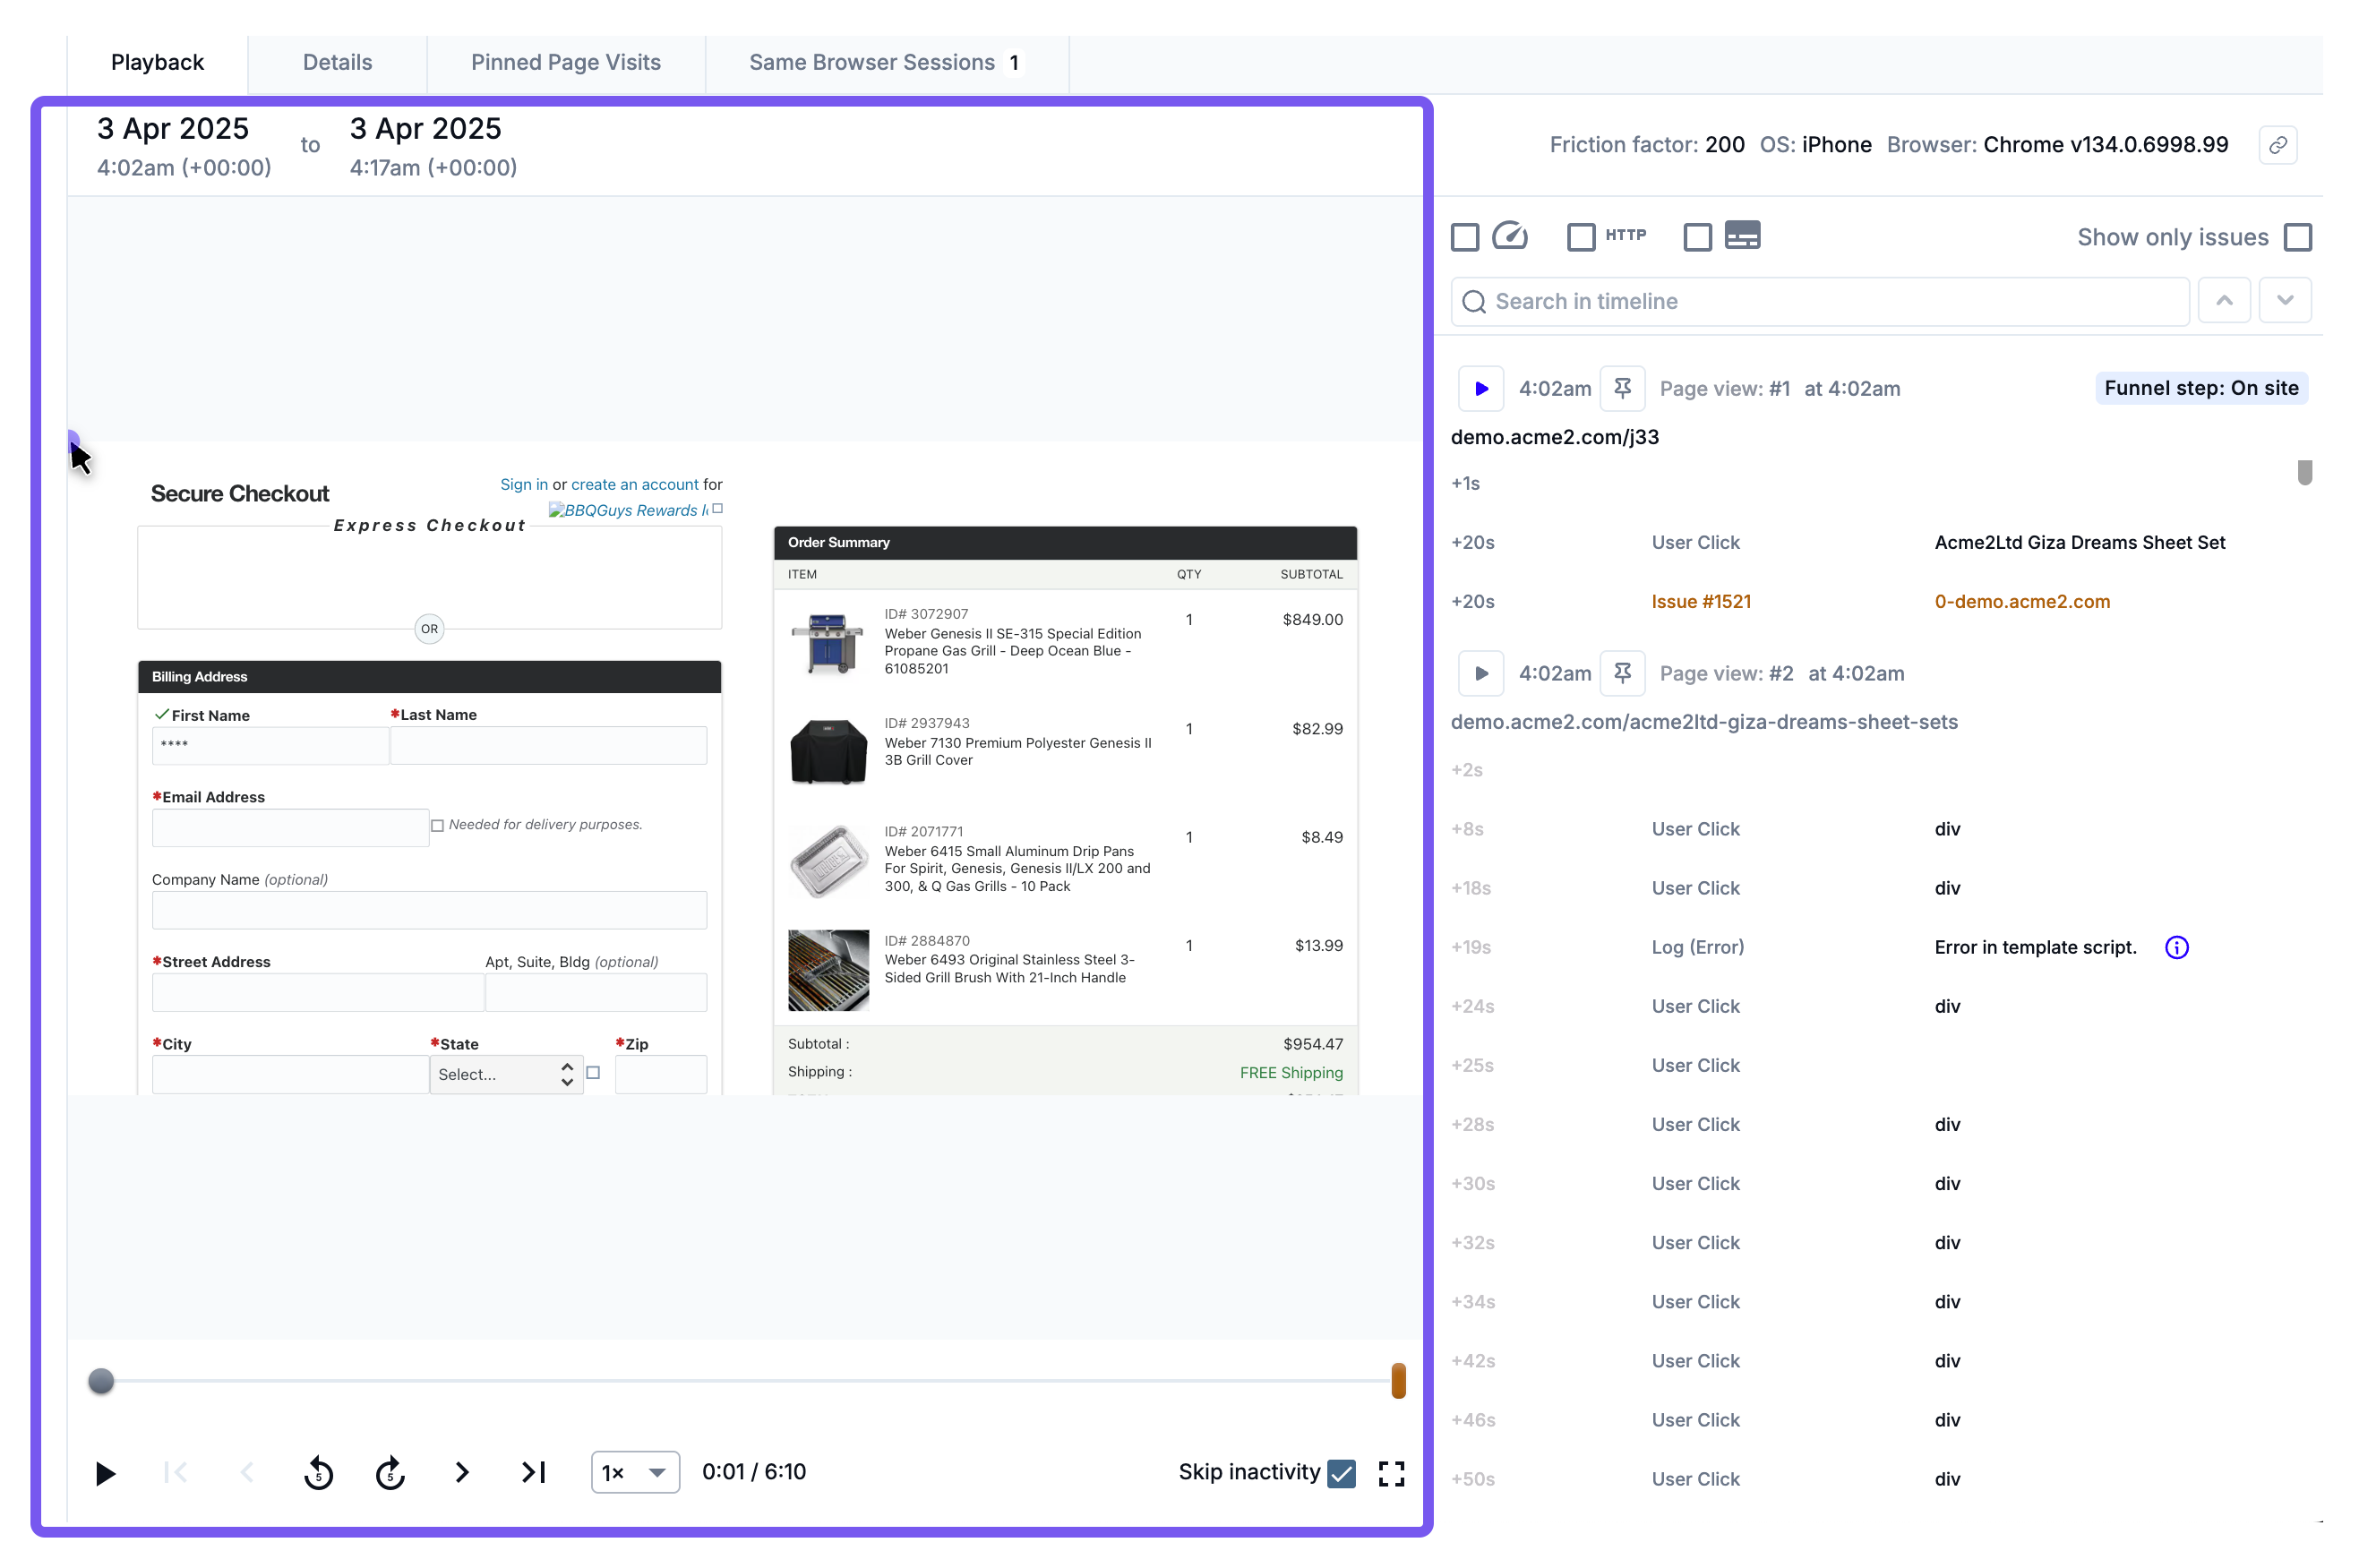
Through the Session Player, you can watch a customer's session and see where errors impacted their journey. Session videos block out user-identifying information, but you can track the customer's progress by following the mouse movements on screen. You can speed up the playback to 2x, 4x, or 8x. You can also slow the playback down to ½X or ¼X.
Above the player, a banner lists the date, time, and timezone of the session recording. At the top-right, you'll see important details about the session recording, including the friction factor, operating system, browser, and browser version.
Session Timeline
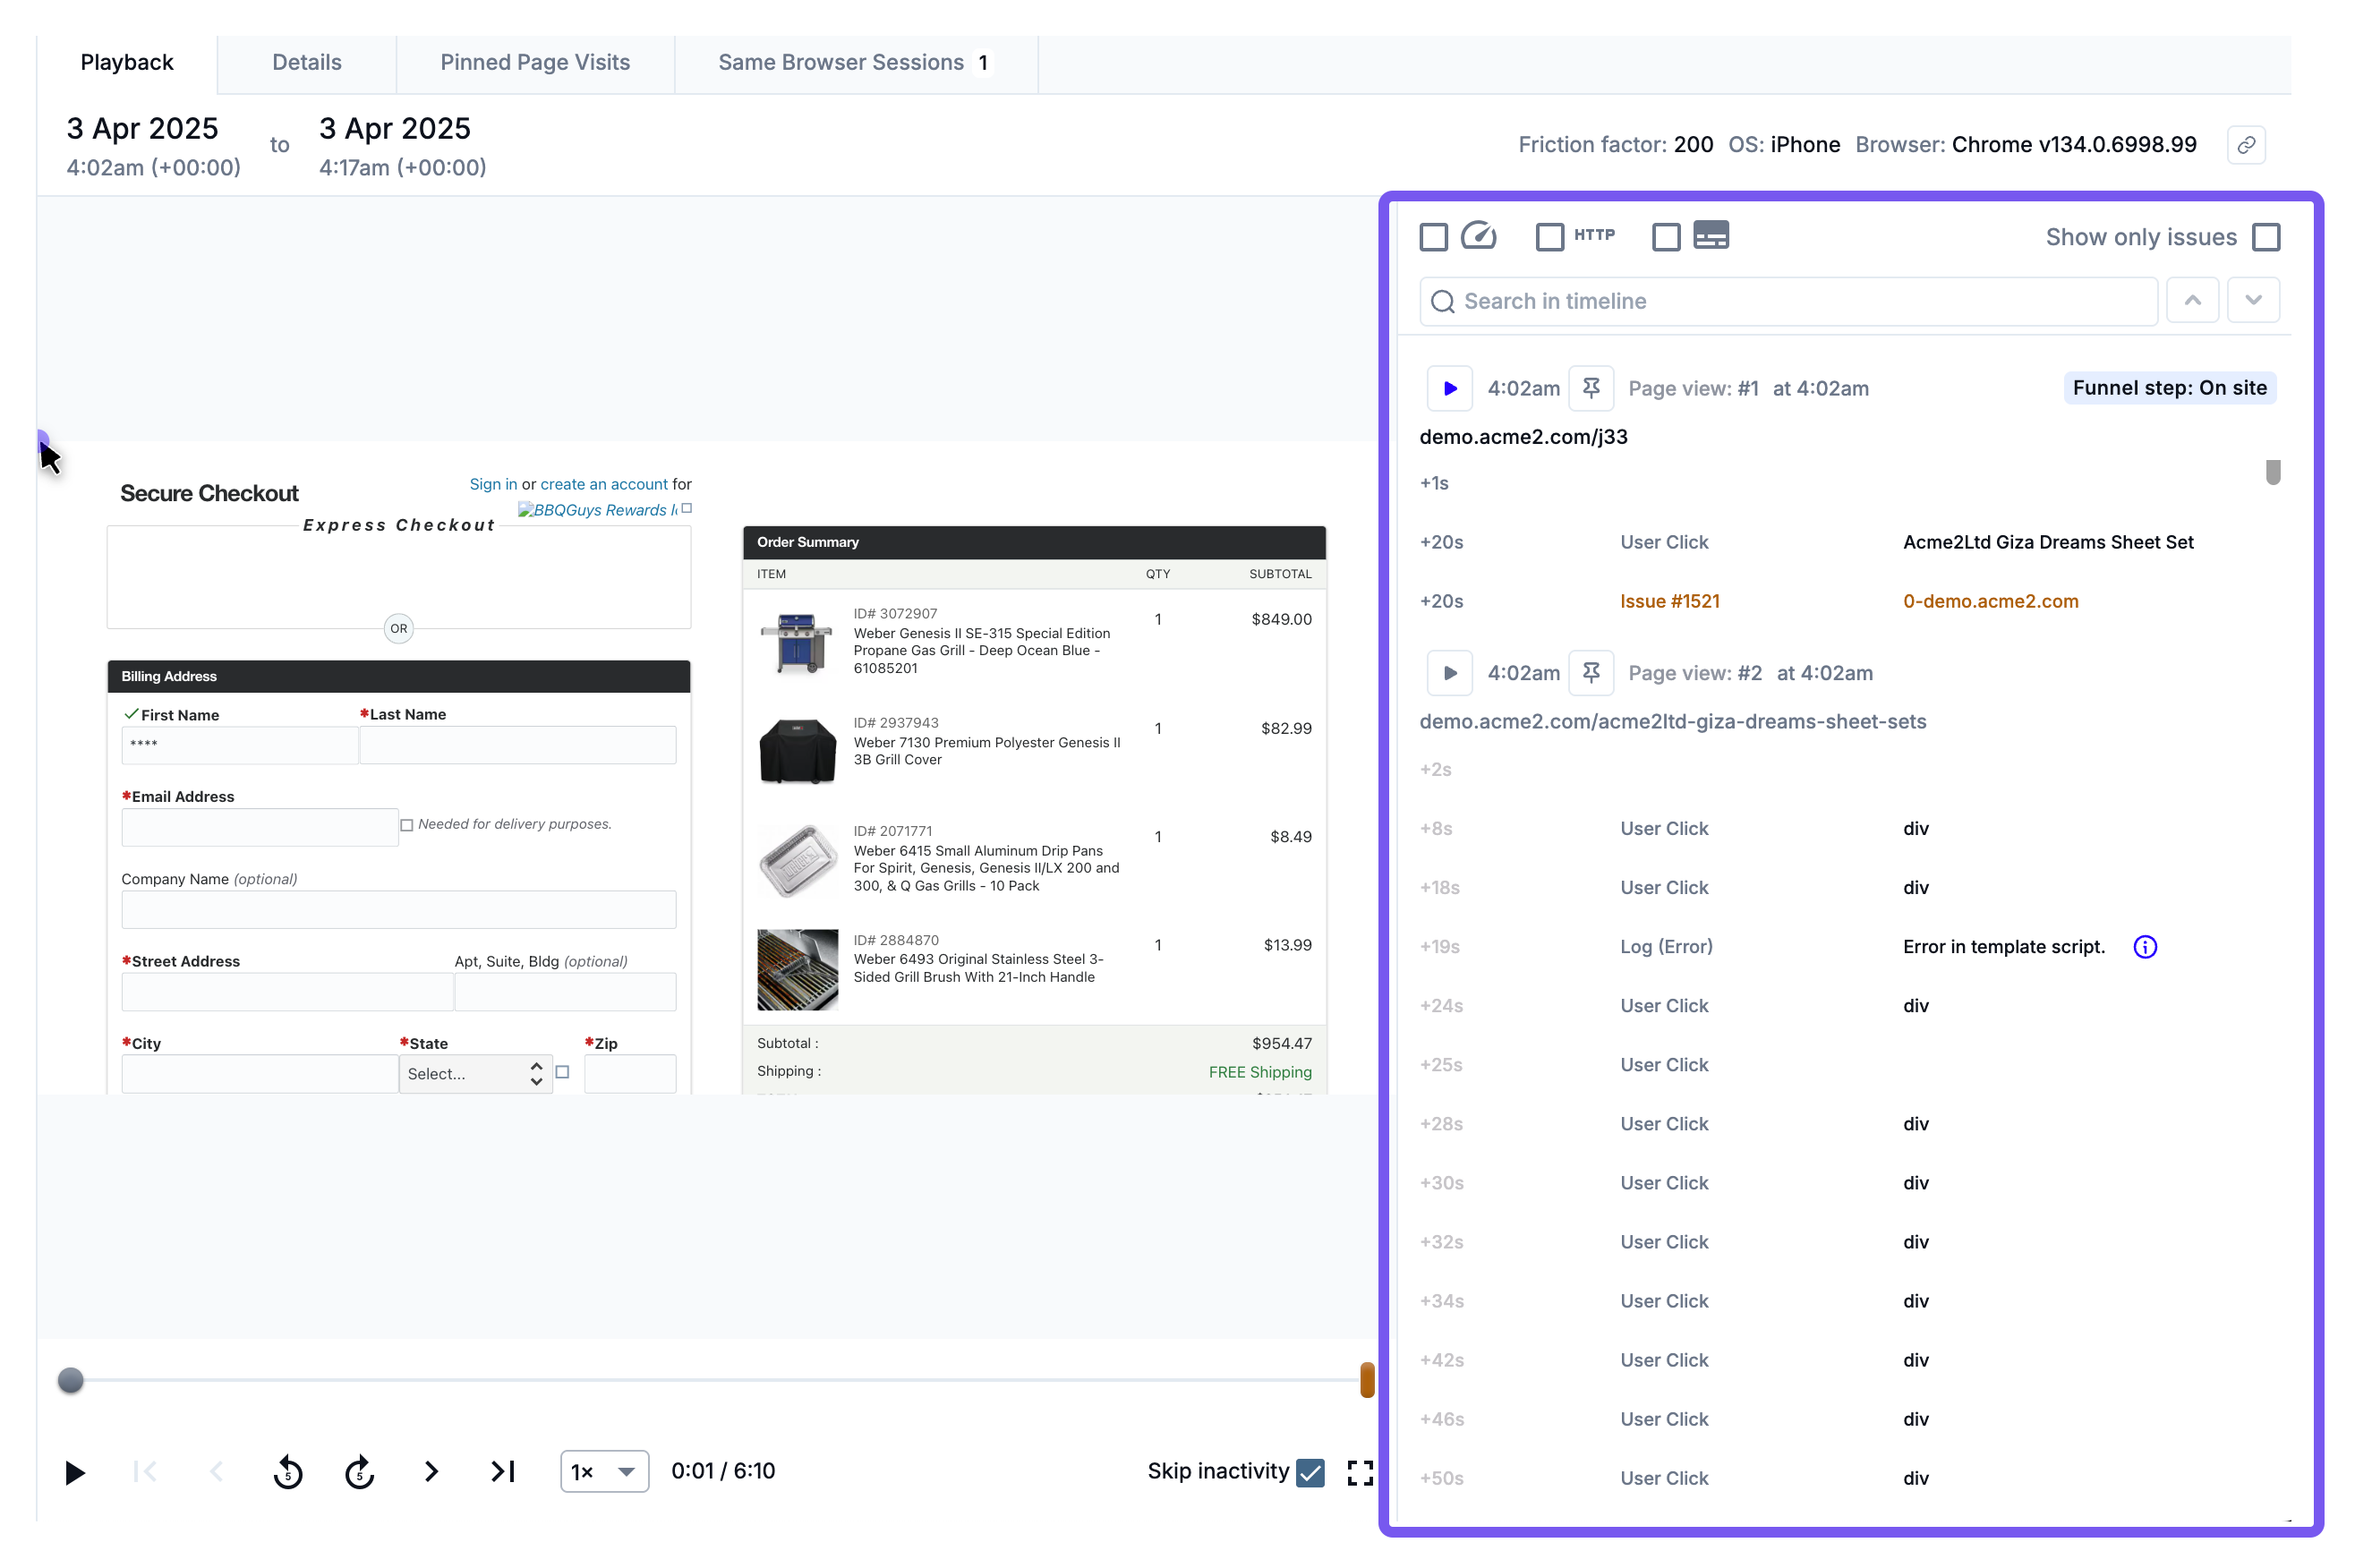
The Timeline tracks every event captured in the session video, with timestamps associated to each major action. This could include user interactions like clicks, keyboard inputs, on-screen errors, and more.
Any associated techncial Issues identified by Noibu are highlighted in orange. Clicking on the issue number will take you the details page for that issue for further investigation.
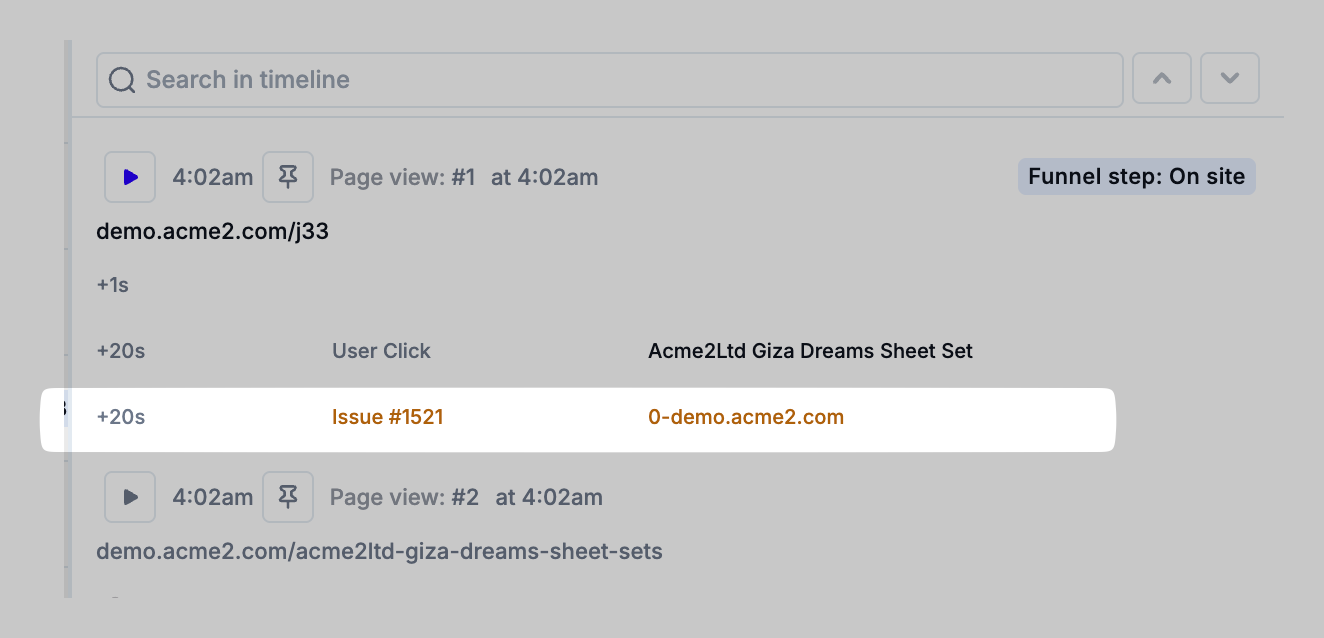
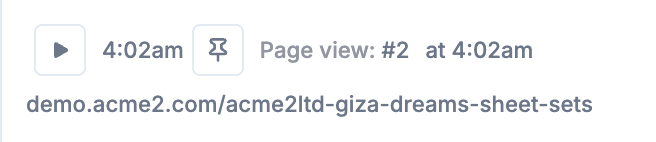
The session timeline is divided into the individual pageviews that make up the full user session on your site. Buttons along the left side of the timeline allow you to play or pin a segment of the session.
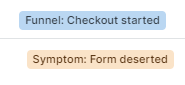
The timeline also includes diagnostic markers on the right side of the timeline, indicating the funnel step present in each video and the primary symptom(s) experienced at each step.
Enabling additional details in Session Timeline
By default, the session replay timeline does not display core web vitals, page lifecycle events, HTTP events. You can enable each of these by checking the relevant box.
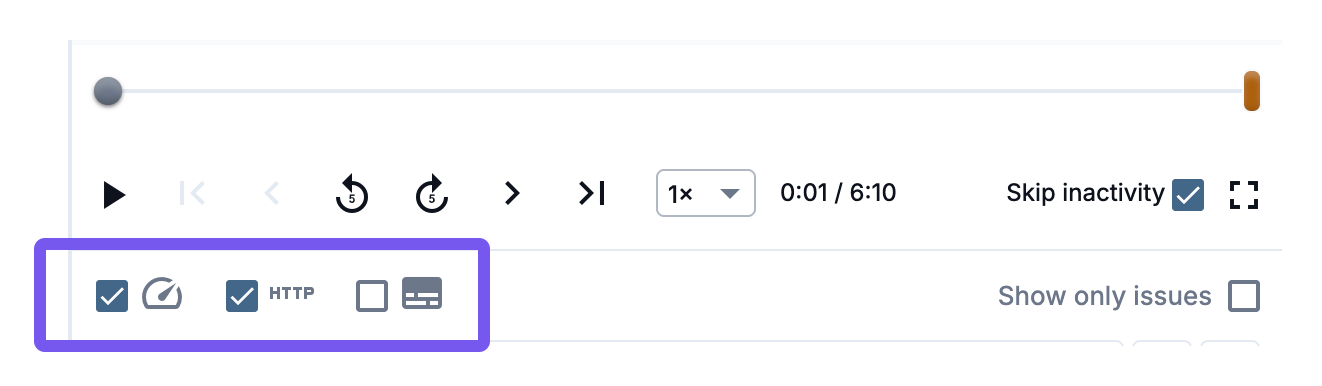
Web vitals: Web vitals represent elements of the user experience in a session that can be measured, quantified, and rated on a three point scale: Good, Improvable, or Poor. When enabled, web vital events will appear in the timeline next to its overall score.
HTTP events: If your domain has HTTP Data Collection enabled, you can select an event to open the event's header, payload, and response information. However, not all HTTP entries will have event information. Events with purple arrows can be expanded, while events without details are grey and non-interactable.
Page lifecycle events: Page lifecycle events provide additional, granular context to what’s happening on the browser during a user’s session.
Searching for specific session details
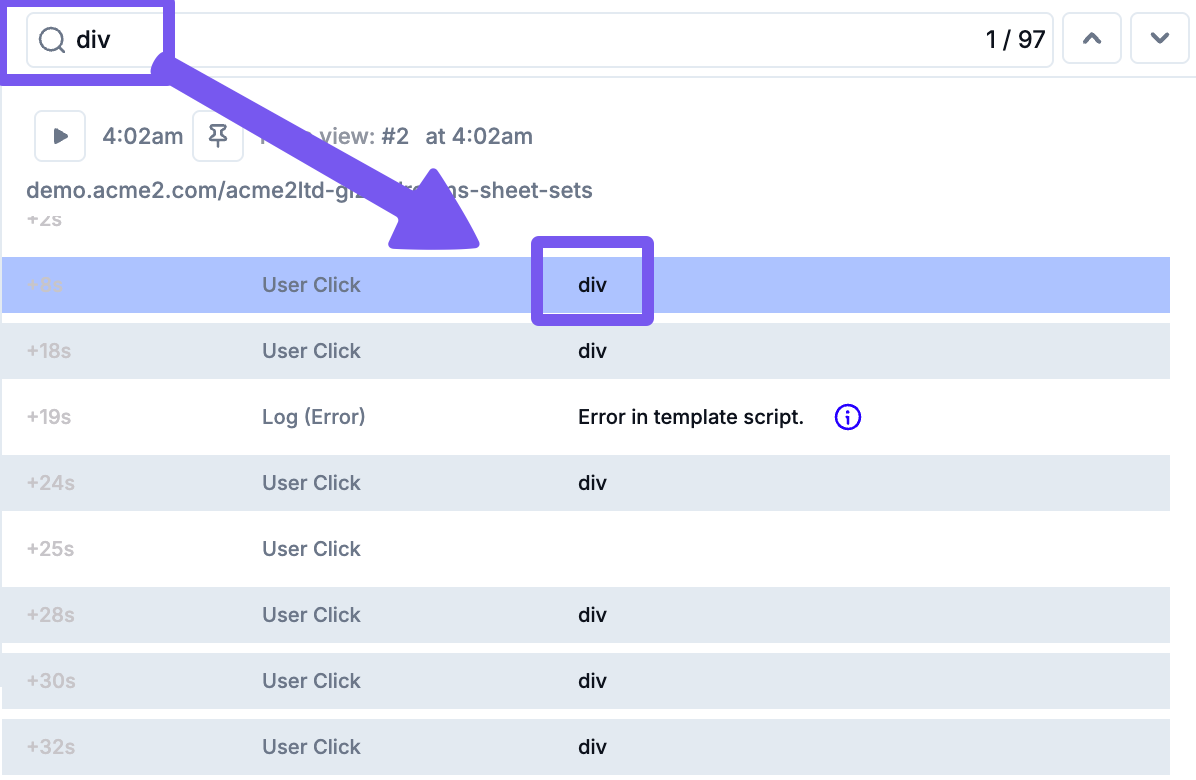
Below the session timeline toggles is a search field, which allows you to find specific rows within the session timeline. This allows you to find specific HTTP events, user clicks, URLs, symptoms, and more. Rows in the timeline that match your search will be highlighted accordingly.
The Session View also includes tabs for Details, Pinned Page Visits, and Same Browser Sessions.