Overview of Issues page
Last updated: April 15, 2026
Noibu's lightweight script runs in the background of your website to detect bugs and errors. The Issues page provides you with a high-level look at each error impacting your ecommerce site, as well as the tools you need to prioritize, diagnose, investigate, and resolve them.
This page displays issues on four views, each with its own set of filters Filters to surface relevant issues:
In each table, issues are listed with a unique identifier and descriptive title. Other columns can be added or removed from the table by clicking the Manage Columns button. Learn more about the various columns available here.
Pinned Issues
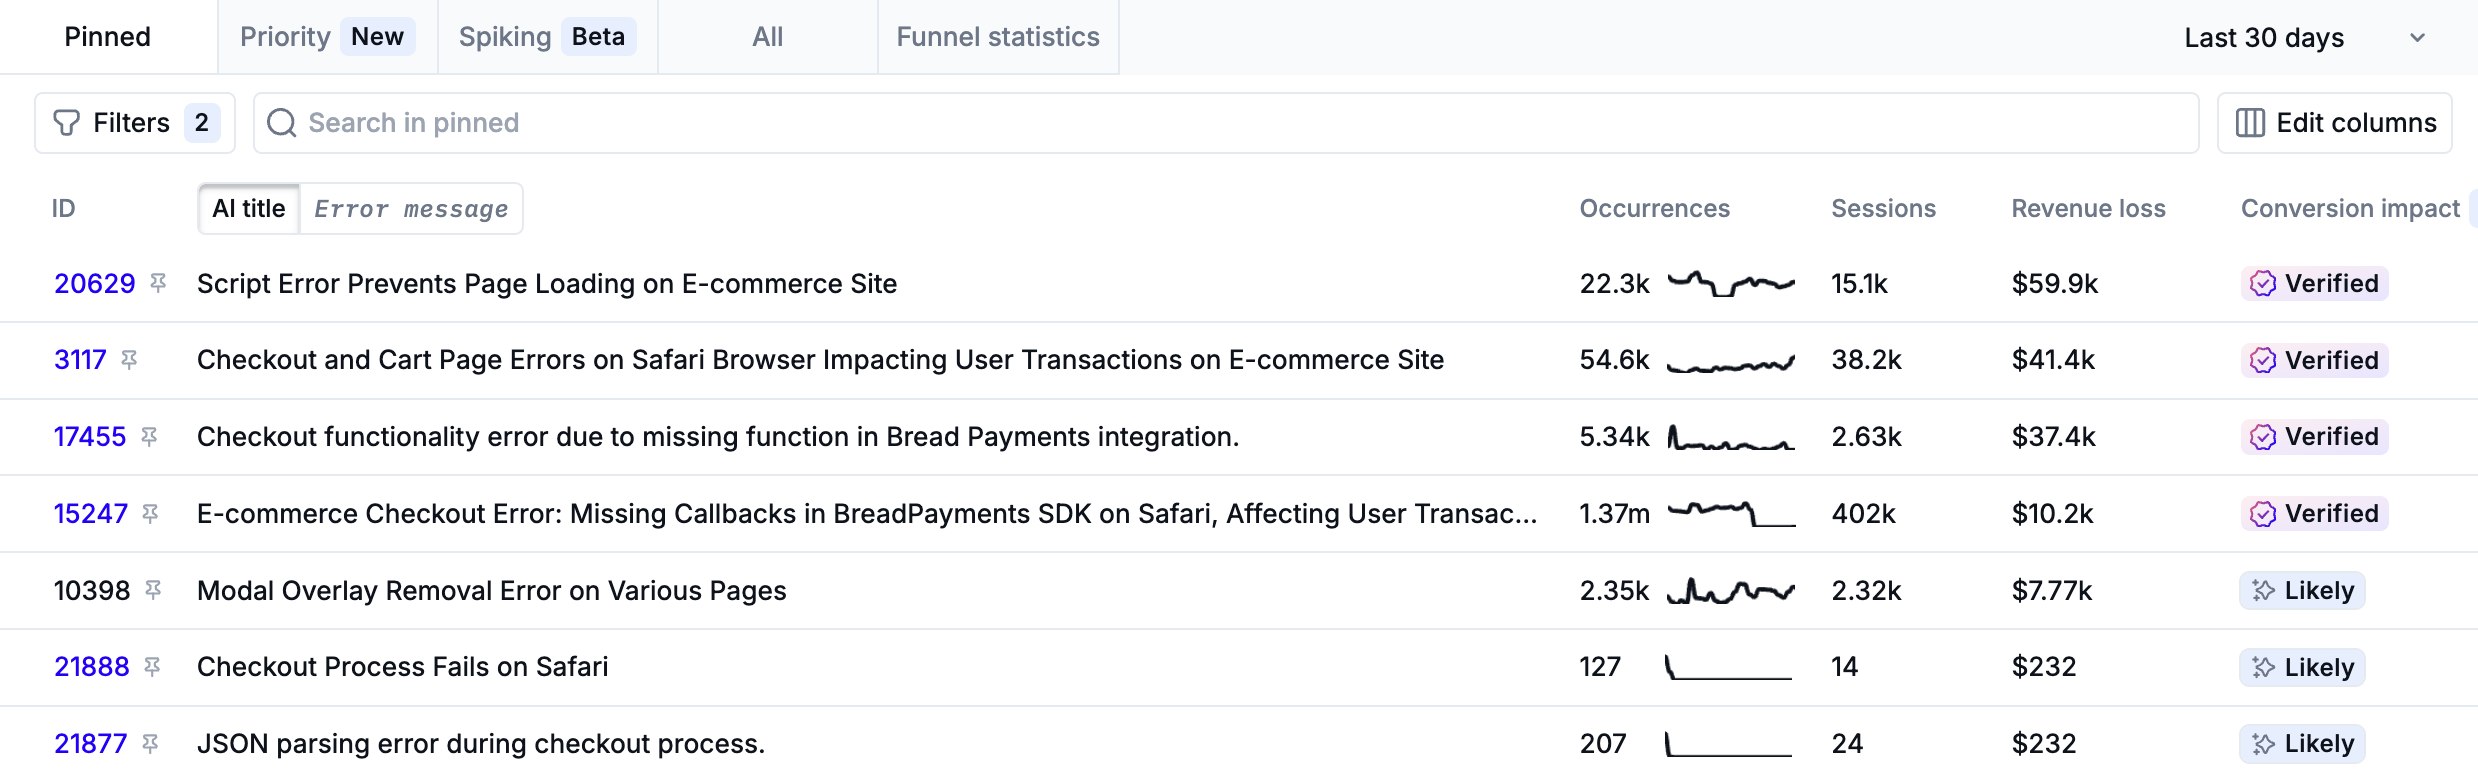
The Pinned Issues tab lists issues that have been specifically triaged as user-impacting. Any Issue in Noibu can be Pinned as it is investigated and triaged. Setting an issue’s classification to “Pinned” surfaces it in the Pinned Issues tab, so technical teams can easily see where to focus their efforts.
The Pinned Issues tab will not include issues that are Closed-Fixed, or Closed-Ignored, even if they're classified as Pinned.
Priority Issues
The Priority Issues tab is often your first starting point to investigate and triage errors on your website. This tab surfaces a selection of issues that are both revenue-impacting and resolvable to help you focus on the highest-impact errors.
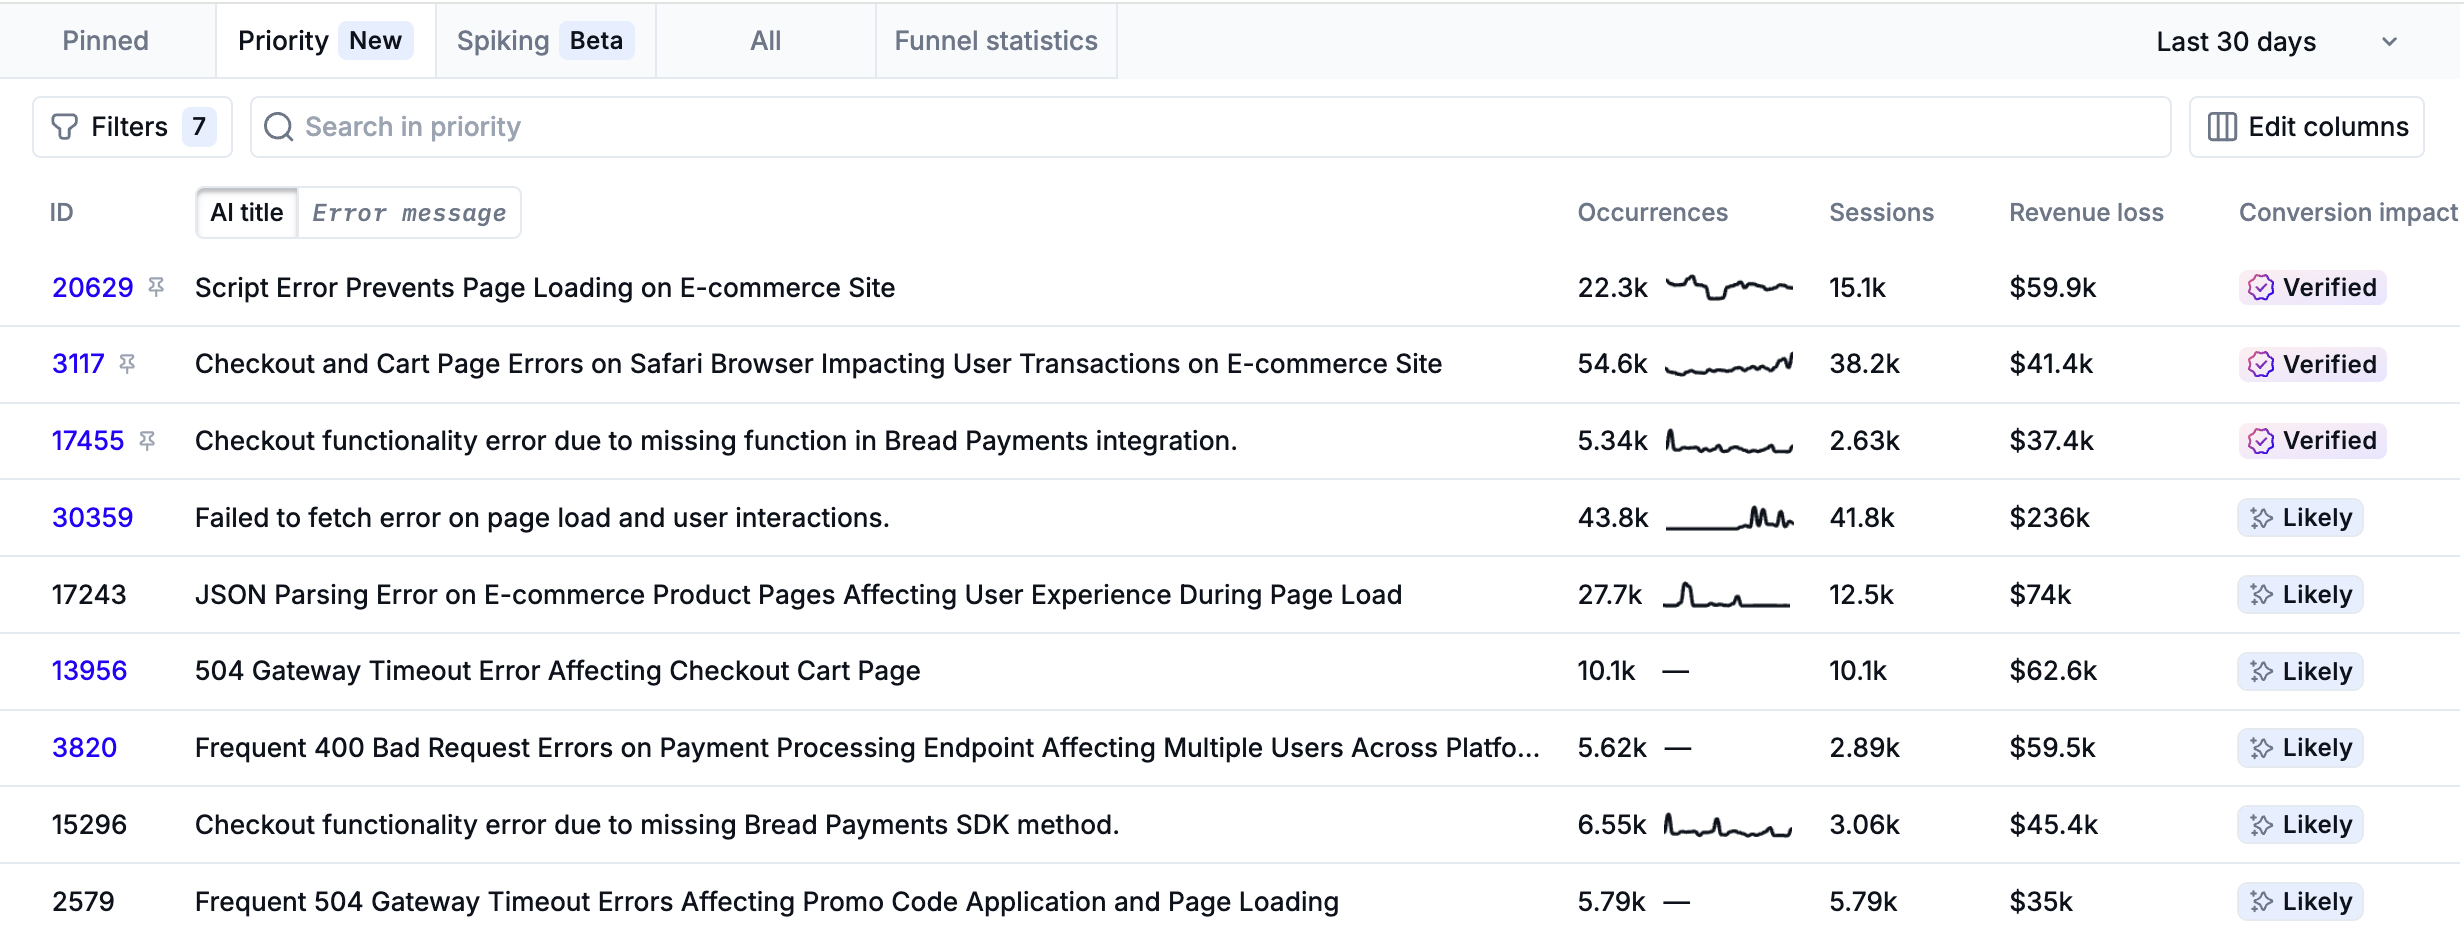
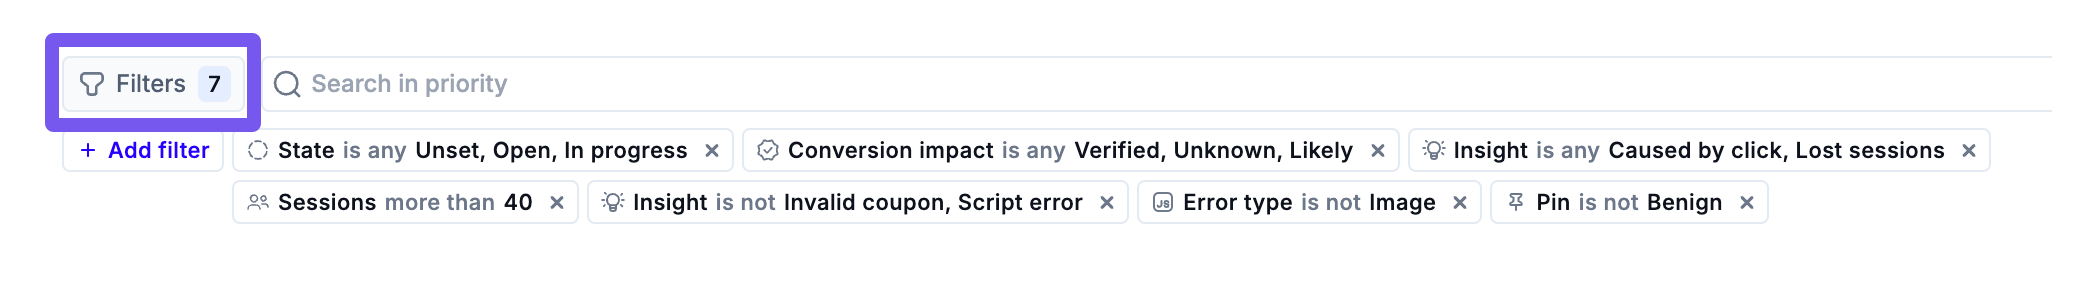
The Priority Issues view applies a set of filters to surface high-priority issues. By default, this view will only show issues that meet the following criteria:
The issue’s state is Open, New, or In Progress.
The Conversion Impact is Verified, Likely, or Unknown.
The issue is tagged with the Caused by Click or Lost Sessions or Frequently broken image insights
The issue is NOT tagged with the Invalid Coupon or Script Error insights
The Issue has occurred in more sessions than the threshold set on your domain details page
Additionally, issues that are tagged with the Dormant insight will be filtered out.
Clicking the Filters toggle allows you to see which filters are applied to the Priority Issues view and make adjustments. In particular, you're encouraged to change the Sessions filter to a threshold that makes sense for your particular business. Learn more about filtering issues.
Spiking Issues
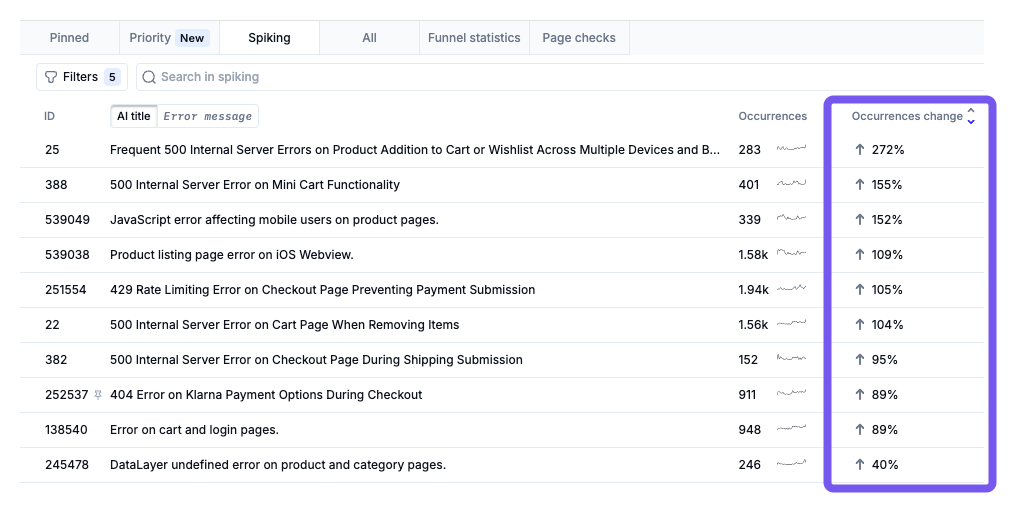
The Spiking Issues tab displays a list of issues that have significantly increased in frequency of occurrence over the past day or past week. It helps you monitor for problems caused by a recent release, and detect pre-existing issues that have suddenly intensified.
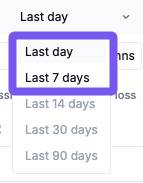
Adjust the time period selector to view issues with occurrence spikes in the last day, or over the past 7 days. 14-, 30-, and 90-day views are unavailable at this time. You can also apply additional filters to this view.
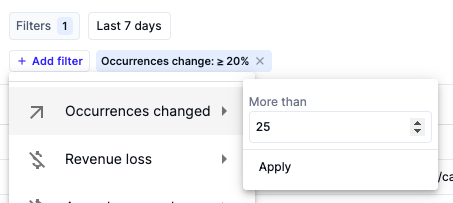
This tab is sorted by occurrence change to show those issues with a dramatic increase in occurrences first. By default, this tab surfaces issues where Occurrences have increased by ≥20% over the selected period of time. You can customize this threshold by clicking the ‘Add filter’ button, and choosing the ‘Occurrences changed’ option.
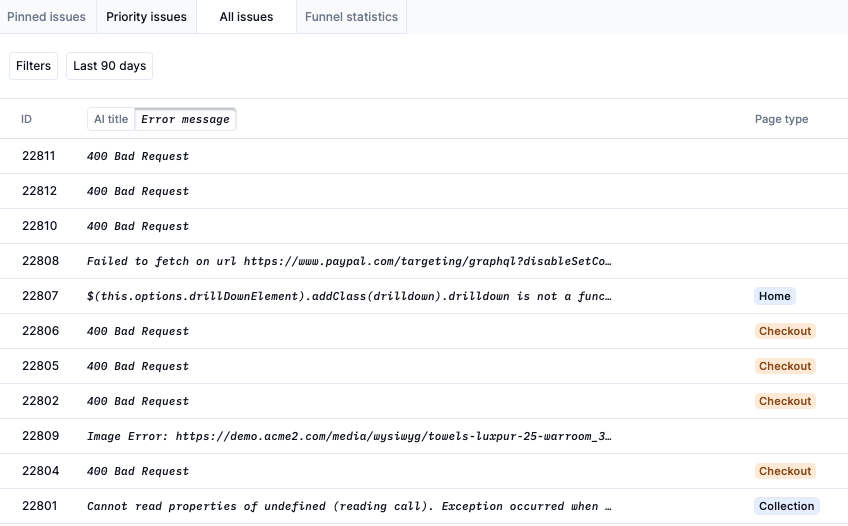
All Issues
While the Priority and Spiking views list a subset of Issues that are likely to be the most important to investigate, the All Issues view lists every issue. By default, this view orders issues by creation date.