Using Store Pulse
Last updated: August 20, 2026
Overview
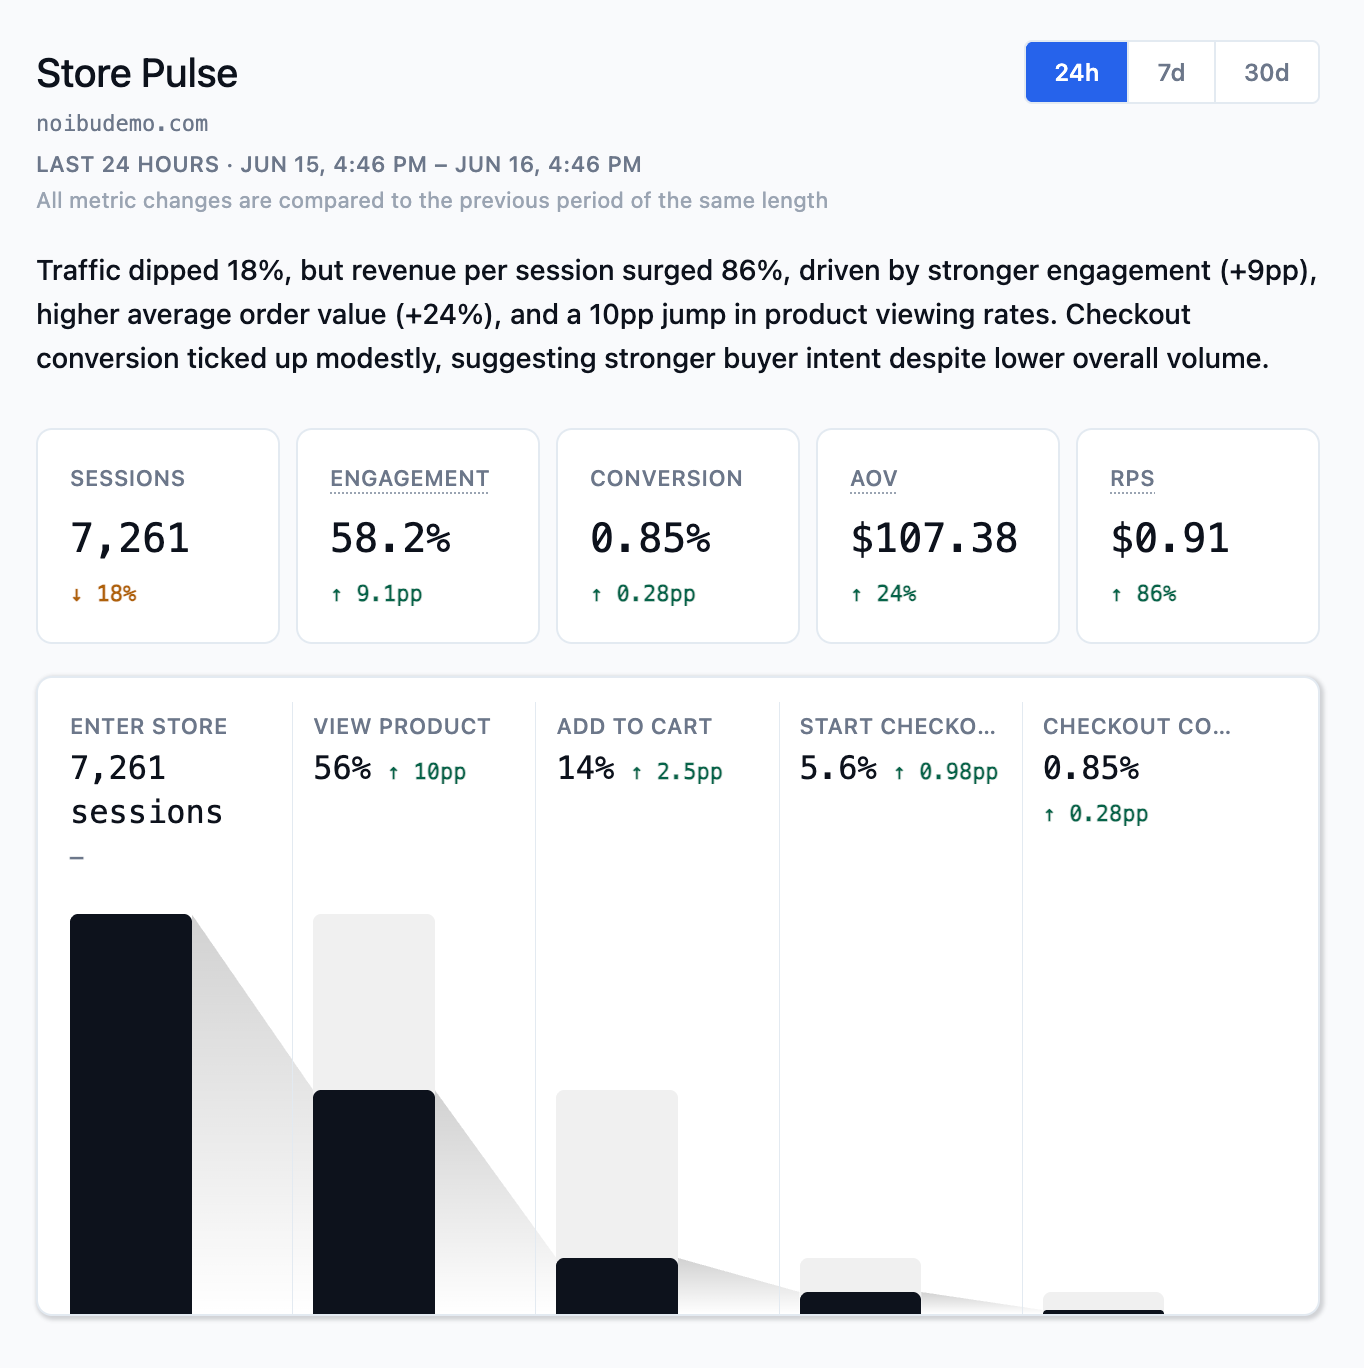
The Store Pulse skill (/store-pulse) gives you an at-a-glance read on your store's health over the last day, week, or month — core metrics and the purchase funnel, rendered directly in the conversation. You can save the result as a live dashboard your team reopens at any time, or schedule it as a recurring brief delivered to Slack or email.
This skill is included with Noibu's AI plugin.
When to use it
First thing in the morning, as a check on whether anything needs attention
Before a leadership update, when you need current numbers without opening a dashboard
As a shared, always-current view the rest of the team can open without asking you a question
As a daily or weekly brief pushed to a Slack channel, so store performance reaches people who would never log into an analytics tool
If the snapshot surfaces something that needs explaining, Store Pulse hands off to the specialist skills — Checkout Analysis, Segment Analysis, Product Analysis, or Tech Diagnosis.
How to trigger it
Ask "how is my store doing today?", "give me a store overview", or type /store-pulse.
What you get
The default response is an inline snapshot: two or three sentences of plain-language summary, a widget with your metrics, and three suggested follow-up questions drawn from what the numbers show. The snapshot always includes two blocks.
Core metrics
Sessions
Engagement
Conversion rate
Average order value
Revenue per session
Purchase funnel
A five-step view of how sessions progress toward a completed order.
Optional blocks
When you save Store Pulse as a dashboard, you can add three more blocks:
Top products — your five highest-traffic products with add-to-cart rate against a site benchmark
Channel performance — sessions, engagement, conversion, and revenue per session by traffic channel
Paid performance — Google, Facebook, and Instagram traffic performance
Note: Paid performance describes on-site behaviour attributed by last-touch UTM parameters. Ad platforms may apply their own modelled and view-through attribution, so these numbers will read differently from Google Ads or Meta Ads Manager.
Saving as a live dashboard
From the snapshot, click Save as dashboard or ask your AI tool to save it. The skill asks which optional blocks you want, then builds a persistent dashboard.
The dashboard is live rather than a screenshot. Each time you open it, it queries Noibu again and renders current data. That is what separates it from a downloaded report: the dashboard shows the store now, the download shows the store at the moment you generated it.
Real merchant use-case
A DTC accessories brand replaced a weekly manual product-performance report with a live Store Pulse dashboard. Anyone on the team opens it and gets current numbers rather than waiting for the report cycle, and the weekly report stopped existing as a deliverable.
Scheduling a recurring brief
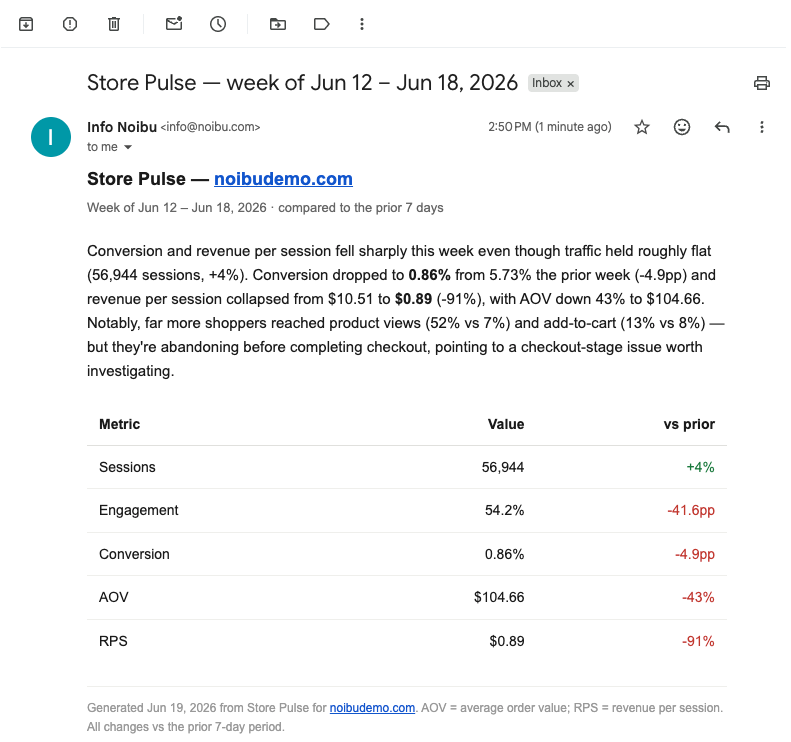
In addition to a saved dashboard, Store Pulse can be used to create a scheduled brief that comes to you. Ask your AI tool to schedule a Store Pulse report, or click Schedule on the snapshot. A short form collects the cadence, the day and time. The report can be delivered via Slack or Email, depending on which connectors are active in your AI workspace.
You can also extend the brief beyond the standard blocks: ask for a scheduled task that runs Store Pulse alongside other Noibu queries — for example, new priority errors in the last 24 hours, or a Core Web Vitals check against your baseline — and delivers the combined result.
This is how most merchants build a morning brief that answers "is anything wrong today?" before the team starts work.
Real merchant use-case
A home goods brand keeps a saved dashboard that pairs Store Pulse metrics with Core Web Vitals per URL and priority error counts against the prior period, as its standing view of site health.