Using Product Analysis
Last updated: August 20, 2026
Overview
The Product Analysis skill (/product-analysis) shows which products, collections, and product types are working and which are quietly losing customers. It surfaces products that get views without sales, products where add-to-cart rate lags their traffic, and where shoppers drop out of the product funnel.
This skill is included with Noibu's AI plugin.
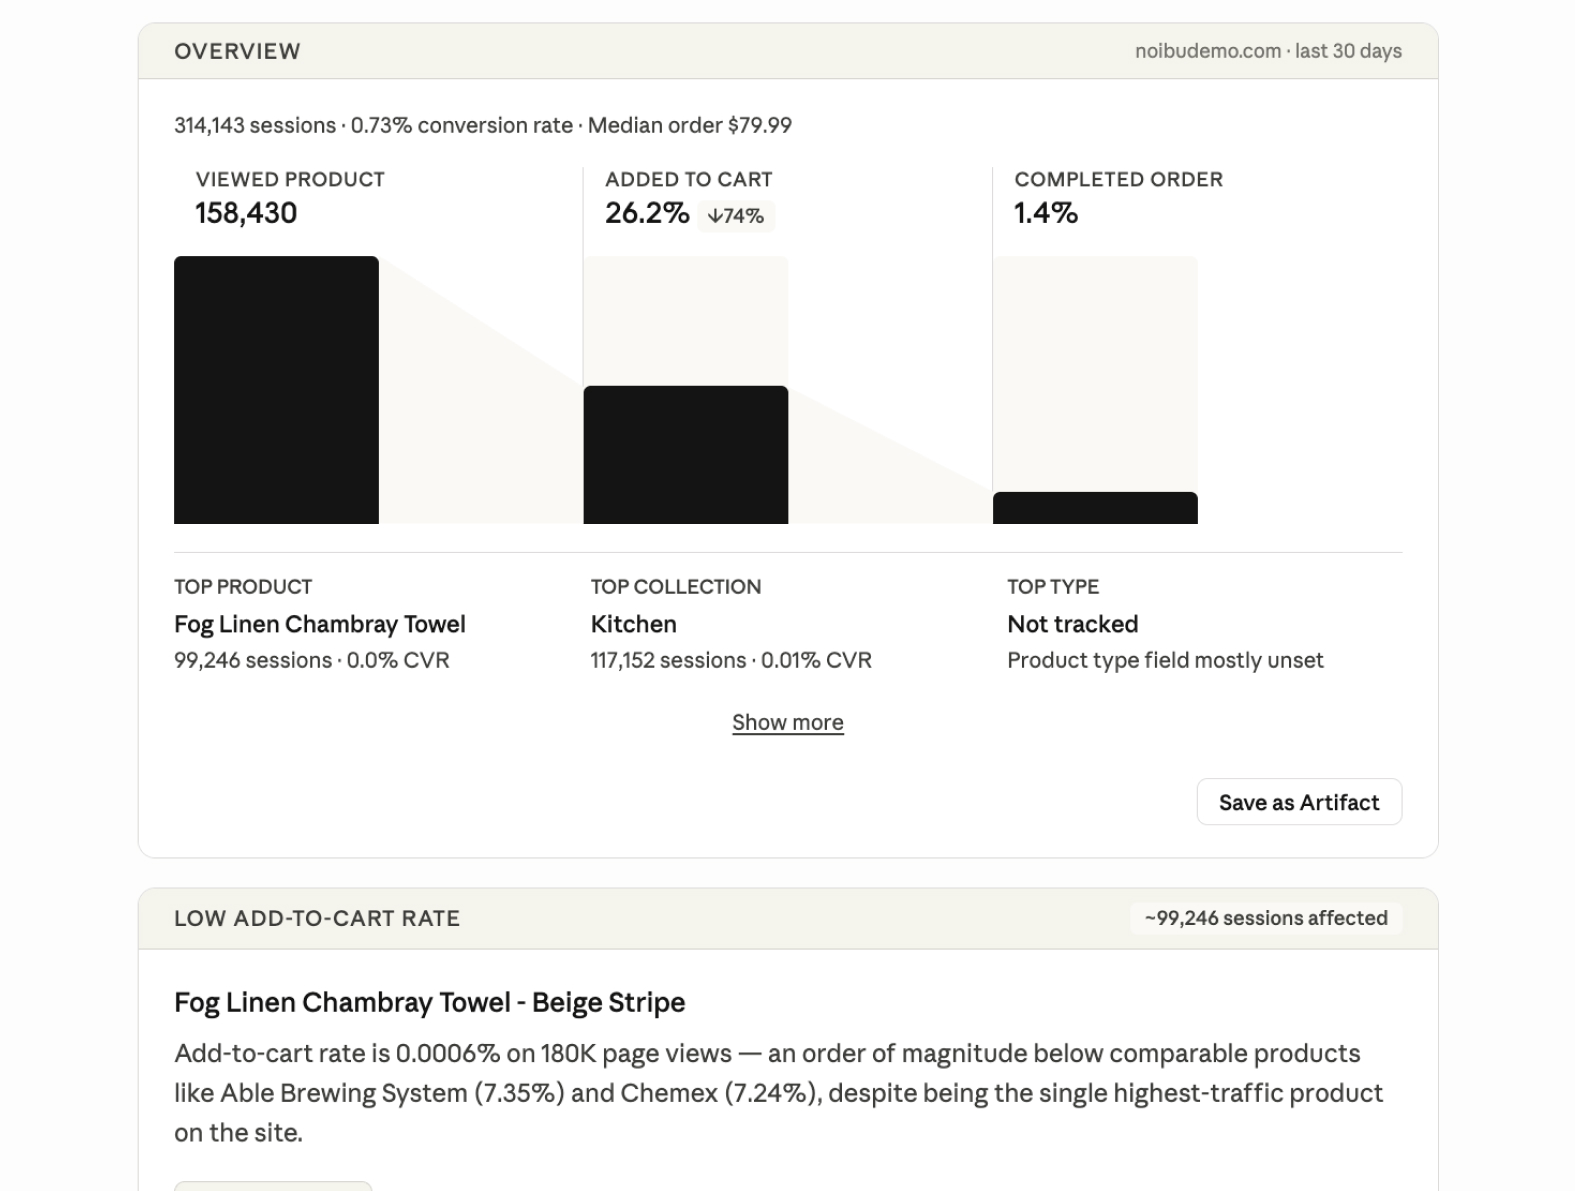
This skill tells you which pages deserve attention and why. Product Content is a related skill that acts on the findings when the problem is the copy.
When to use it
Before a merchandising decision, to ground it in what shoppers are actually doing
After a product page redesign, to check whether it moved add-to-cart rate
When a specific product or collection feels like it should be performing better
When planning a seasonal promotion and you need candidate products with proven customer interest
When a product page gets traffic but no add-to-carts and you do not know why
How to trigger it
Ask “which products are underperforming?”, “how is the Sale collection performing?”, “why isn’t my polo converting?”, or type /product-analysis.
Like the other analysis skills, it answers a narrow question directly and runs the full workflow for a broad one.
What you get
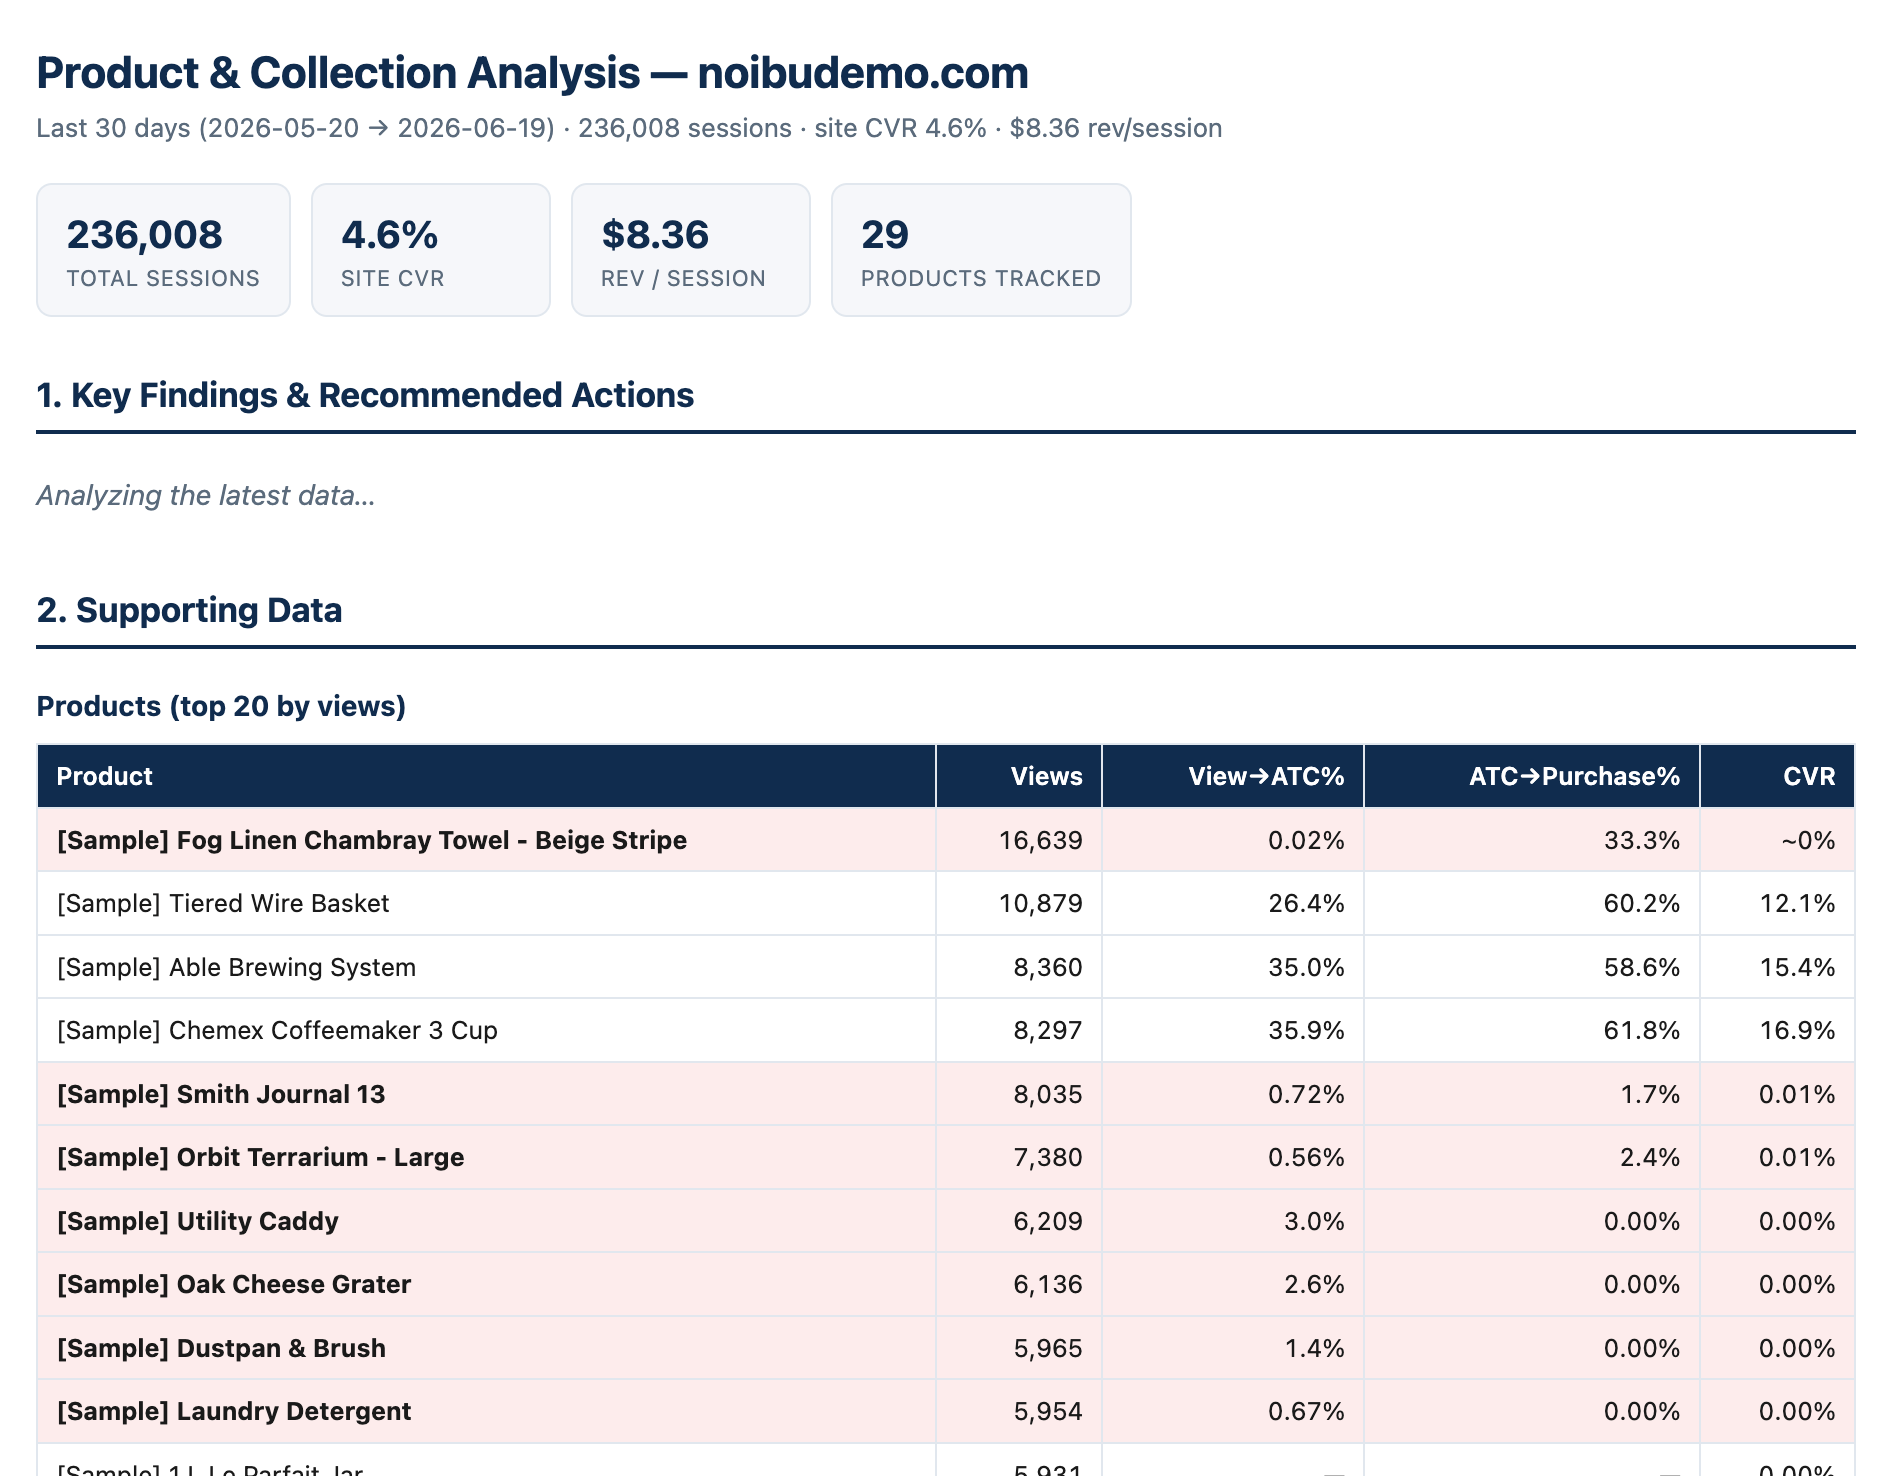
An overview across products, collections, and product types — views, add-to-carts, purchases, conversion rate, and revenue per session.
Priority findings, ranked, each with an Investigate button that runs a focused follow-up.
An option to download the report, save it, or schedule recurring insights.
Common follow-ups
Add-to-cart rate for a specific product against its traffic
Exit rate and scroll depth on a product detail page
What shoppers who did not convert clicked instead
How a collection performs against your other collections
Where shoppers drop out of the product funnel, by device or channel
Real merchant use-case
Merchants planning seasonal campaigns use the most-viewed and most-added-to-cart lists to find candidates ahead of a holiday push — products with demonstrated customer interest, rather than the products the team assumed would sell.
How the data is interpreted
Product data produces misleading comparisons unless the analysis is careful. Four guards are built in.
Conversion rate is compared only within a price tier. A $20 product and a $400 product are not comparable on conversion rate, and ranking them together produces a list of your cheapest products.
Revenue per product is not reported. Noibu measures order value at the cart level rather than the line-item level. A product that appears in high-value orders is not necessarily driving that value, so attributing order revenue to individual products would be wrong.
Near-duplicate product titles are flagged rather than merged. Variants and similarly named products are surfaced as possible duplicates for you to judge, instead of being silently combined.
Sessions that viewed a product but progressed no further are labelled “viewed only”, rather than being counted as a funnel drop-off at an ambiguous stage.
Acting on a finding
Clicking Investigate produces a focused follow-up rather than rebuilding the board.
Technical causes — an error on the product page, a Core Web Vitals problem — hand off to Tech Diagnosis.
Merchandising, content, localization, and UX causes return one concrete recommended action and the check that confirms it worked.
If the recommendation concerns the copy on the page — the title, description, bullets, or call to action — Product Content is the skill that writes and publishes the change.
Real merchant use-case
An accessories brand identified high-exit product detail pages using scroll depth and exit rate, and redirected promotional spend toward pages where conversion was suppressed rather than pages that were already working. The findings set the next merchandising cycle.