Using Tech Diagnosis
Last updated: October 9, 2026
Overview
The Tech Diagnosis skill (/tech-diagnosis) finds and fixes technical problems on your store using your Noibu data. This skill is included with Noibu's AI plugin. It handles two kinds of problem, each with its own workflow:
Error resolution — JavaScript errors in your store's code that interrupt shoppers, traced to the file and line that causes them.
Performance — slow or unstable pages, measured by Core Web Vitals from real shopper traffic.
You can run the skill in two ways. Name a specific error or slow page, and it investigates that one problem. Run it without a target, and it scans your store and ranks the highest-impact errors and performance problems it finds.
Where the fix is a code change and your store's code is in a connected GitHub repository, the skill can write the change and open a pull request for your team to review and merge.
Connecting your tools first
Before investigating a specific problem, Tech Diagnosis checks which of the following tools are connected and offers to connect any that are missing. Each one sharpens the result, and the skill still runs if you skip them.
GitHub — lets the skill search your source code to confirm the cause and identify the exact file and line. It is also the only route by which a fix can be written and opened as a pull request.
A browser extension for your AI tool, such as the Claude extension for Chrome — lets the skill open the affected page in a real browser, including on an emulated mobile device.
Shopify — only when your store runs on Shopify and GitHub is not connected. It lets the skill check your live theme and store settings, so the diagnosis is based on your real store rather than general patterns.
Important: The Shopify connector is read-only. It informs the diagnosis but cannot change your store. A code fix reaches your store only through GitHub, so if your theme is not in a connected GitHub repository, Tech Diagnosis can diagnose the problem fully but cannot open a pull request for it.
Running a scan
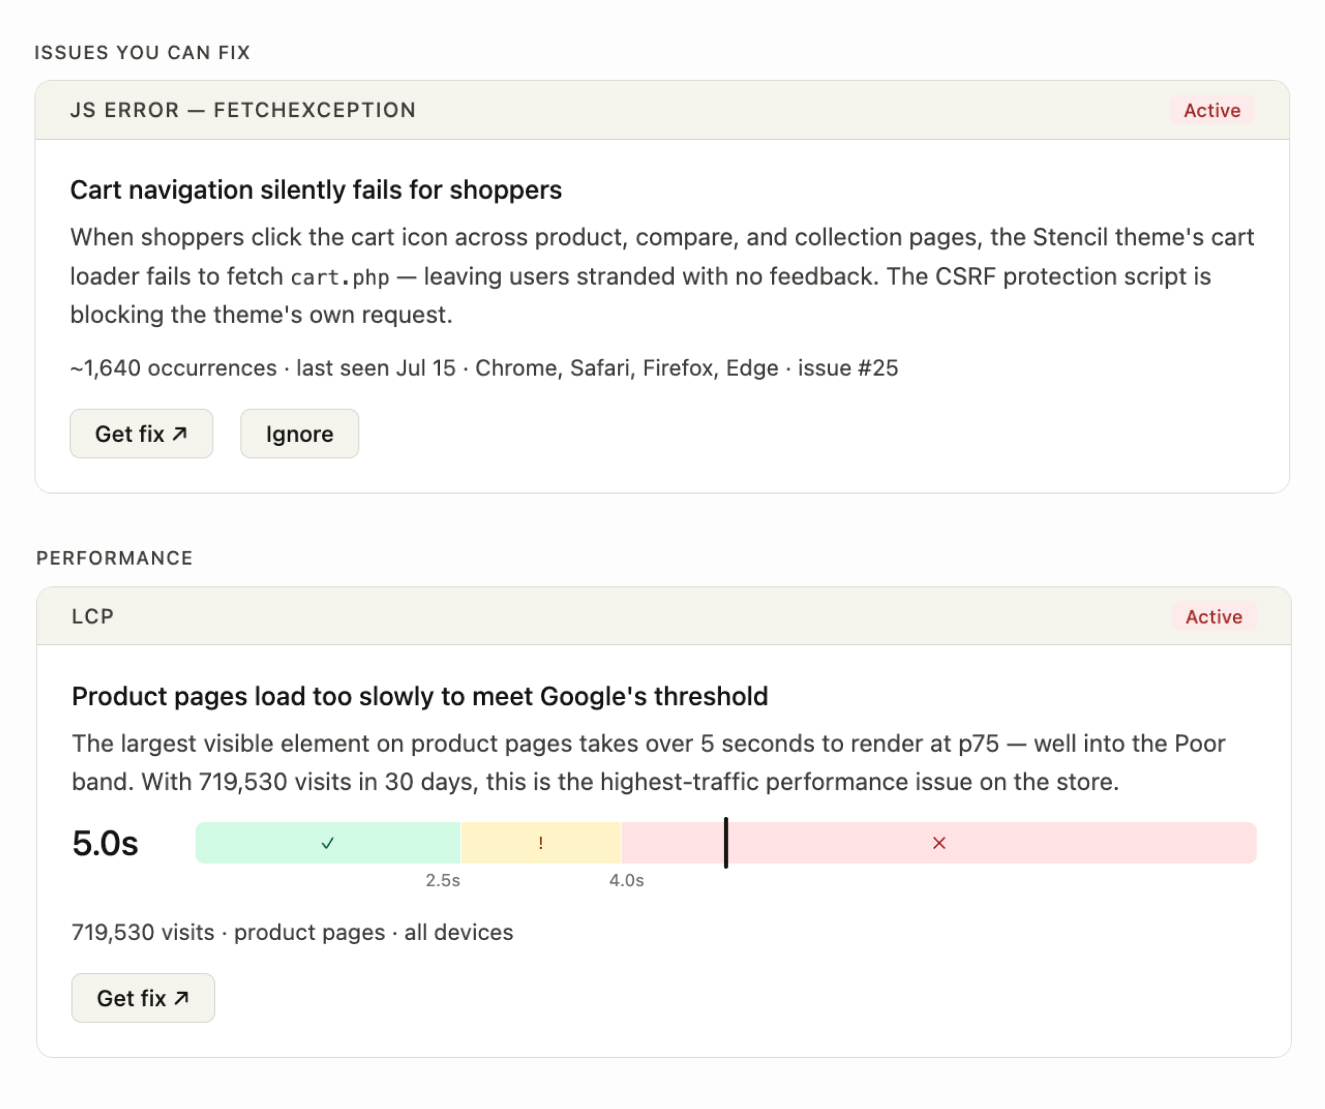
Run /tech-diagnosis without naming a problem, or ask "what's broken on my store?", and the skill scans for errors and performance problems at the same time. Results appear in an in-chat dashboard with three sections:
Issues you can fix — errors in code your store owns.
Performance — pages outside the "Good" range on Core Web Vitals.
Vendor issues — errors caused by a third-party app that has its own support channel.
Each finding shows a trend badge — Active, Re-emerging, or Improving — and the actions available for it. Click Get fix on any error or performance finding to start a full investigation.
Findings are ranked by how much they affect shoppers, weighted by where in the funnel they happen. A checkout problem outranks a homepage problem of the same size.
Error resolution
The Error resolution agent finds the JavaScript errors in your store's own code that interrupt shoppers, traces each one to its root cause, and drafts the fix.
When to use it
A priority error is hurting checkout or conversion and you need the root cause
You shipped a fix and want to confirm in the data that the error has stopped
You installed an app or changed your theme and want to catch any new errors it introduced
An error belongs to a third-party app and you need a clear summary to send its vendor
Your error backlog needs cleaning up and you want to dismiss issues you will not act on
Ask "what's the root cause of issue #299?", "is this checkout error still active after my deploy?", or "what's causing errors on Safari mobile?" You can also click Get fix on an error in a scan.
Real merchant use-case
After an app or theme change, many merchants use the skill to scan for errors first seen in the last 24 hours to catch anything the change introduced.
Investigating an error
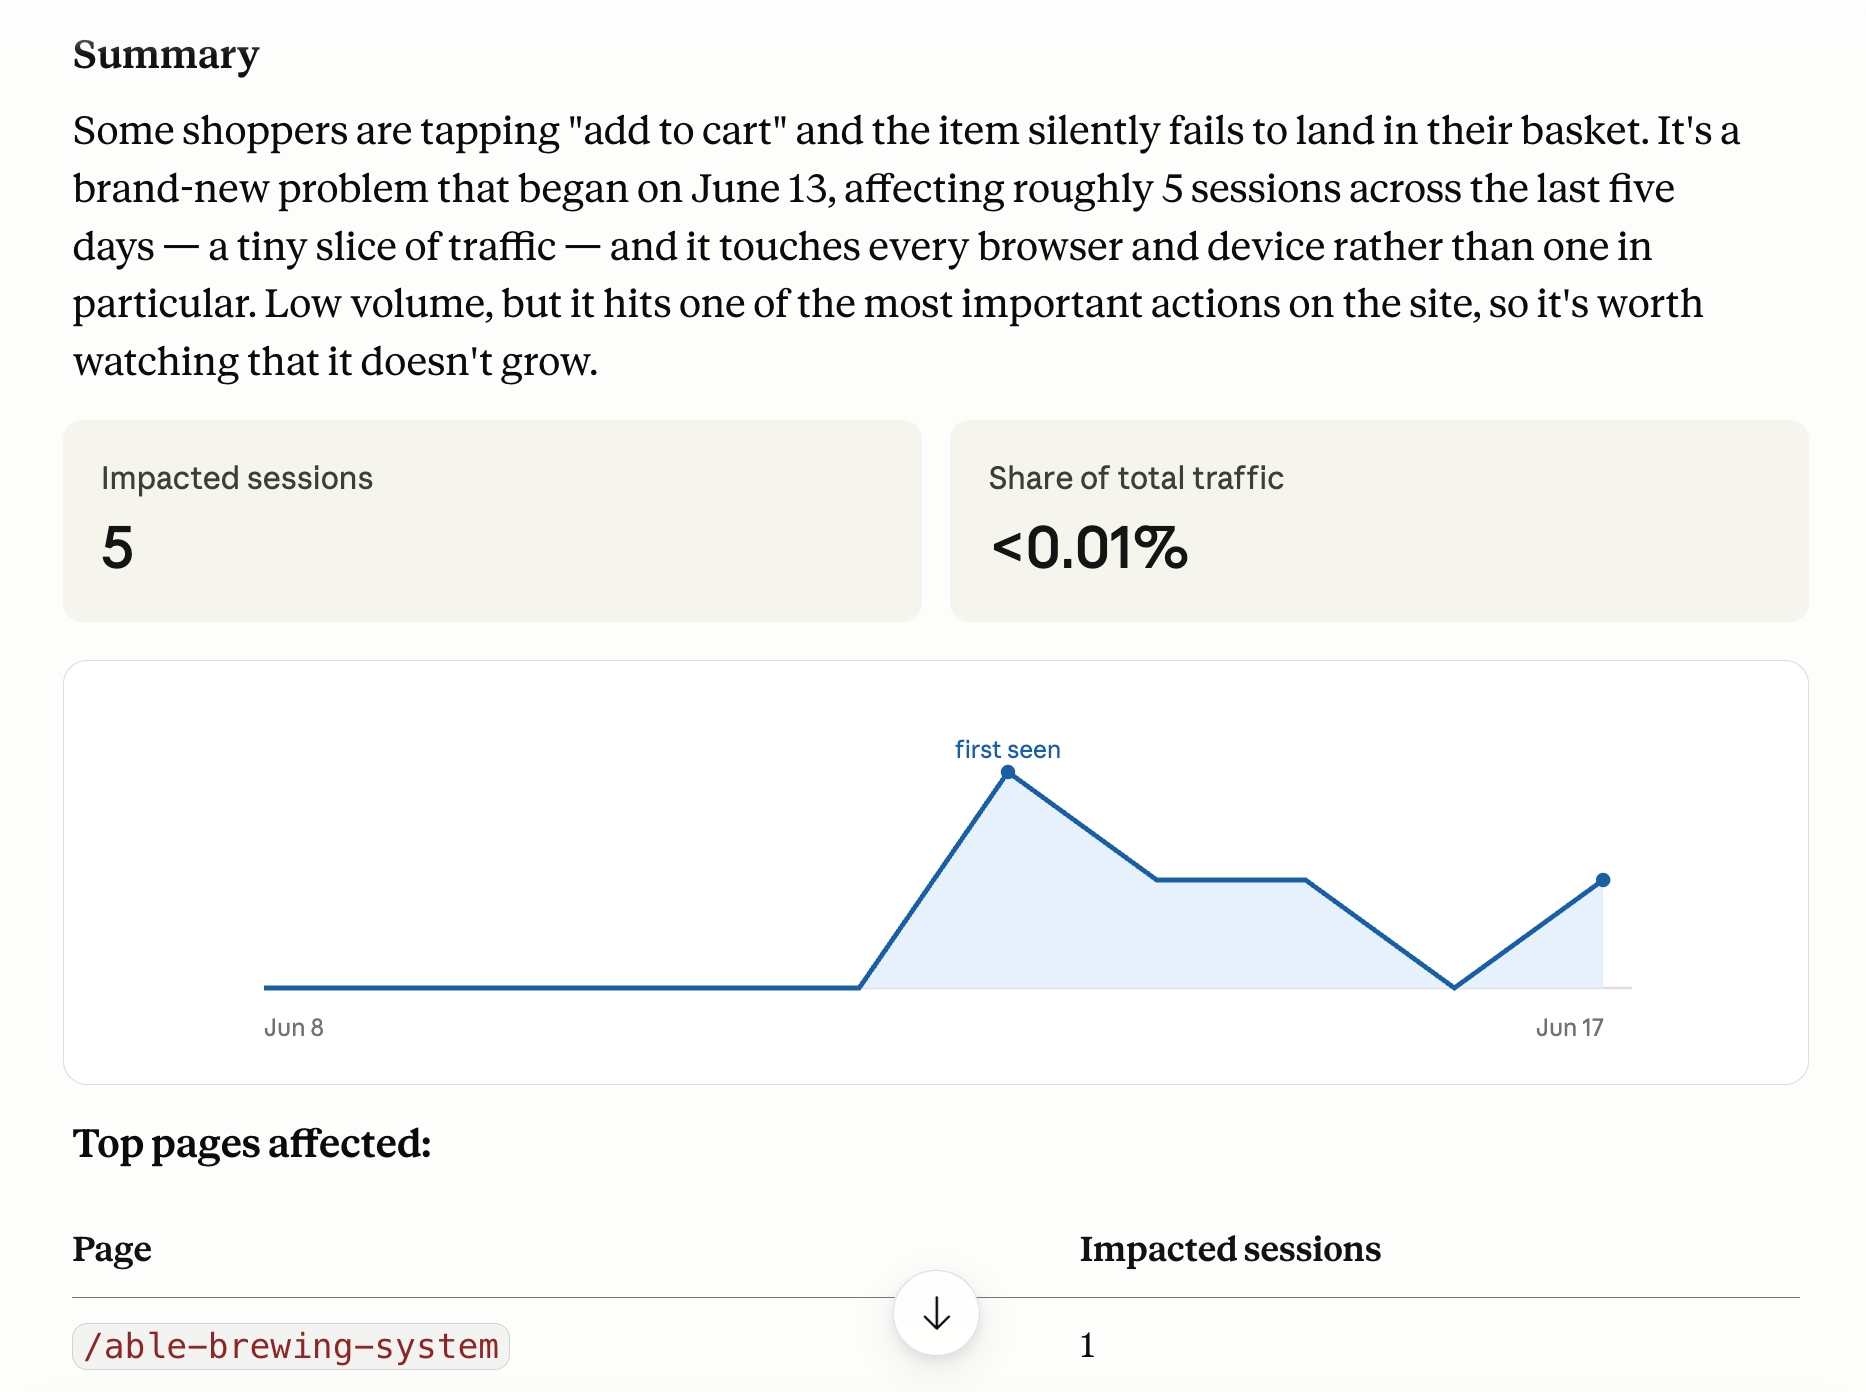
After clicking Get Fix, an investigation works through four sources of evidence:
Noibu's own analysis of what happened and why.
The live page, loaded to reproduce what shoppers experience. With the browser extension connected, the skill opens the page in a real browser, emulating the device where the problem is worst. Without it, the skill reads the page's code directly.
Your repository, searched for the code involved, when GitHub is connected.
Your store's data, queried to confirm or rule out the likely cause, when your ecommerce platform is connected. For example, the skill can check whether a product variant is genuinely out of stock.
The result opens with a summary of who is affected: the number of sessions, their share of total traffic, a trend chart, and the top pages affected. It then states the most likely cause in plain language and notes any alternative explanation in one sentence.
The recommended fix always addresses the underlying cause. The skill does not suggest hiding an error, for example by wrapping code so that the error is silenced.
Which errors count as fixable
A scan looks at the last seven days of active errors and keeps only those that occurred within the last 48 hours and more than ten times in the week. HTTP errors (4XX and 5XX responses) and network connection failures are not included, because without a JavaScript stack trace there is no code to point to.
The skill then reads each remaining error's stack trace (the record of which code was running when the error happened). Errors with no stack trace are skipped. The rest are sorted into one of four groups:
Fixable — at least one frame of the stack trace is in code your store owns. These appear under Issues you can fix.
Vendor — the error comes from a third-party app with its own support channel. These appear under Vendor issues.
Platform — the error comes from your ecommerce platform's own infrastructure. These are left out, because the fix is not yours to make.
Telemetry — the error comes from an analytics, pixel, or tracking script, such as Meta Pixel or Google Analytics. These are left out.
Tech Diagnosis knows which code paths belong to you and which belong to the platform on Shopify, BigCommerce, Magento (Adobe Commerce), and WooCommerce. On headless or custom stores, it applies a general set of rules.
When two errors occur in the same file with the same error message, the skill keeps the higher-impact one and notes the other as a related issue. The investigation then tells you which related issues the same fix should also resolve.
Errors in third-party apps
When an error comes from a third-party app, the skill names the specific service and states that the fix is to contact the vendor, not to change your code. Click Share with vendor on a vendor issue to generate a summary you can copy, covering what is happening, on which pages, how often, and on which browsers and operating systems. If you have email or Slack connected, the skill can send it for you.
Dismissing an error
Click Ignore on any error in a scan to mark it as ignored in Noibu. Use this to clean up issues you have decided not to act on.
Performance
The Performance agent measures Core Web Vitals from real shopper traffic, ranks your slowest page groups by how many shoppers they affect, traces each slowdown to its cause, and drafts the fix.
When to use it
A page loads slowly, or content jumps around while it loads
A performance problem appeared after an app install or theme change
You shipped a speed fix and want to confirm the regression has cleared
You want to know which pages are slowest, and on which devices
Ask "which pages are slowest, and on which devices?", "why is LCP poor on checkout?", or "did my CLS regression clear up?" You can also click Get fix on a performance finding in a scan.
Investigating a slow page
Core Web Vitals are Google's standard measures of how a page feels to load and use. A scan flags any page group with at least one metric outside the "Good" range, and ranks them by traffic and severity. Each finding shows the worst metric, its value, and where it sits against these thresholds.
After clicking Get Fix, an investigation starts with the page's scores broken down by device and browser, so you can see where the problem is worst.
Noibu's data shows how slow a page is. To show why, the skill needs to open the page in a browser. With the browser extension connected, it can identify:
The element that counts as the page's main content for LCP, such as a hero image, and whether it is discoverable in the page's initial code
Which elements shift position and cause CLS
Which element responds slowly to clicks or taps, and which part of the response is slow, for INP
When a problem is worst on mobile, the skill tests the page on an emulated mid-range mobile device with a throttled connection. Without mobile emulation, many layout and loading problems do not reproduce.
Without the browser extension, the skill still diagnoses the problem. It uses the elements shoppers click most to narrow down INP problems, and recommends fixes based on the most common causes for LCP and CLS.
Types of performance fixes
Performance fixes fall into three groups, and the group determines what the skill can do for you:
Theme or code changes — for example, adding image dimensions so content does not shift, or making the main image load earlier. The skill can draft these as a pull request.
Third-party scripts — for example, a loyalty widget, email capture popup, or analytics tag. You cannot edit these directly, but you can reduce their impact by loading them later, reserving space for them on the page, or asking the vendor for a lighter version. The skill recommends which approach to take.
Infrastructure changes — for example, content delivery network (CDN) settings or server response time. These require backend or DevOps access. The skill explains the change, and you can open a ticket for the team that owns it.
When the recommended fix is not a code change, the option to draft a pull request is shown greyed out, with an explanation.
Acting on a diagnosis
At the end of any investigation, error or performance, you can choose from four actions.
➡ Automatically draft a pull request (PR)
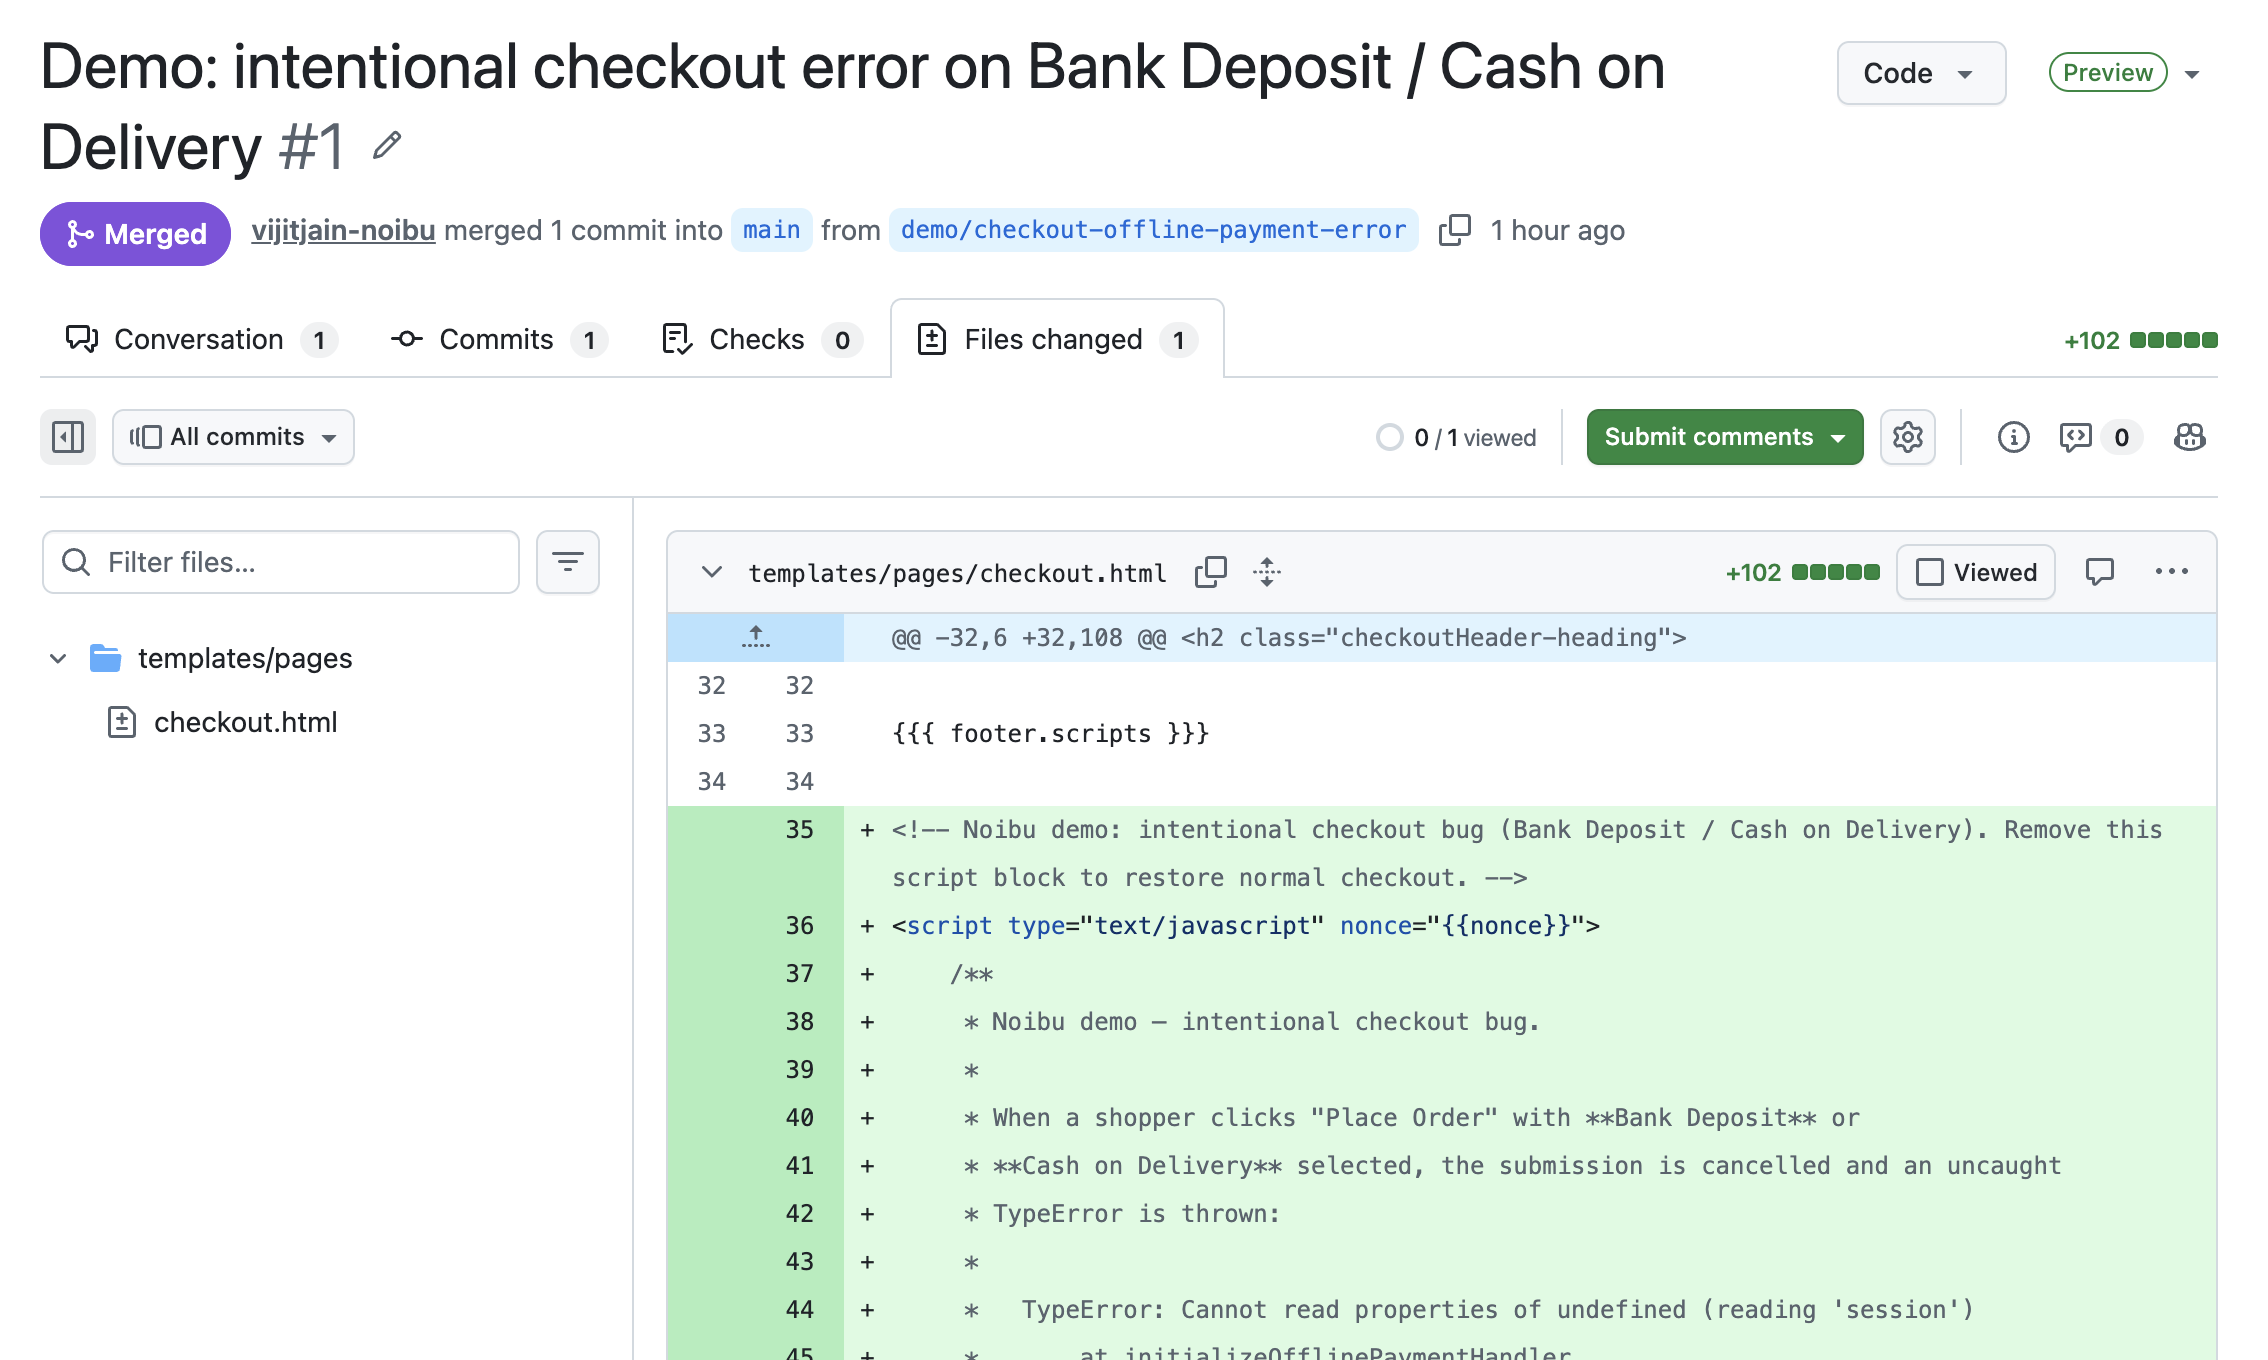
Select Automatically draft a pull request (PR) to have the skill write the fix as a pull request in your GitHub repository. The option shows a low, medium, or high risk label for the change. If GitHub is not connected, selecting it prompts you to connect it. A pull request can be opened only when the investigation identified a specific file and line.
The skill restates the change in plain language and asks you to confirm before it touches your code. It then creates a branch, writes the change, and opens a pull request that sets out the summary, cause, and fix, and references the Noibu issue ID.
Your team reviews the pull request and merges it. Nothing reaches shoppers until someone merges. The skill opens pull requests; it never merges them and never deploys.
Real merchant use-case
A homewares brand with limited development resources cut bug diagnosis from days to under an hour, and confirmed in the data that a fix had landed before the next sale period opened.
If your AI tool has the GitHub connector active, you can instruct the merge from the conversation without opening GitHub. Merging is a repository permission rather than a job title, so a non-technical reviewer can approve based on the plain-language diagnosis, the risk label, and the evidence behind the finding.
➡ Show me the fix
Select Show me the fix to see the specific change: the code or configuration to update, how to test it, and any alternative approach. Use this when you want to review the fix yourself or apply it outside GitHub.
➡ Open a ticket
Select Open a ticket to create a ticket in Linear, Jira, GitHub Issues, or Notion for someone on your team to pick up. The skill asks which tool and which team or project to use, then creates a ticket that includes the full summary, technical details, cause, and fix. Tickets are created for fixable errors and performance findings, not for vendor issues.
➡ Share findings
Select Share findings to send the diagnosis as a PDF, by email, to Slack, or to Notion. You choose whether to include the cause, the fix, and the technical details. The summary is always included.
Scheduling a recurring scan
At the end of a scan, click Set up automations to run it on a schedule: weekly, every two weeks, or monthly, on a weekday and at 7 am, 9 am, 12 pm, or 5 pm. Choose at least one of these automations for each scheduled scan to run:
Auto-draft PR — opens a draft pull request for each finding that can be fixed in code.
Auto-create tickets — opens a ticket for each fixable error and performance finding.
Auto-share report — sends a digest of the scan's findings by email, to Slack, or to Notion.
On a scheduled run, the consent you give at setup replaces clicking each finding, so draft pull requests appear without further action. The merge step is unchanged: nothing ships until someone on your team merges it.
The digest links to each pull request and ticket the scan created. If an automation cannot run for a finding, for example because the fix is not a code change, the digest includes a prompt you can paste into your AI tool to investigate it yourself.