Using Segment Analysis
Last updated: August 20, 2026
Overview
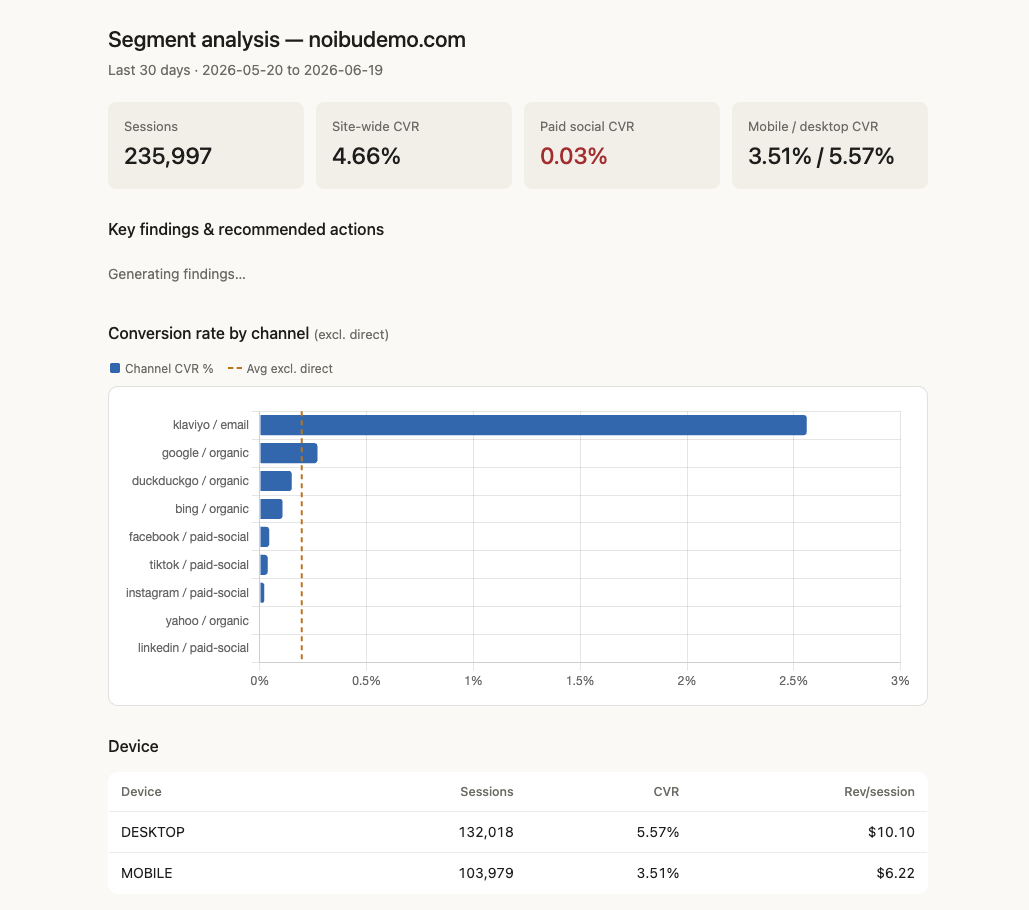
The Segment Analysis skill (/segment-analysis) answers which devices, countries, and marketing channels convert best and worst, and why. It compares each segment against the right benchmark, filters out the false positives that make segment reporting misleading, and returns a ranked board of the gaps worth acting on.
Use it when you need to know whether a problem is universal or concentrated — worse on mobile, specific to one market, or limited to a single campaign.
This skill is included with Noibu's AI plugin.
When to use it
When you want to understand who is converting and who is not
When channel performance shifts and you need to know whether the mix changed or the channel got worse
When you are allocating budget across markets or channels
When a conversion problem might be segment-specific rather than sitewide
When paid traffic is not converting and you need to know whether the problem is the audience or the landing page
Real merchant use-case
Several merchants use Segment Analysis to answer whether a conversion drop is real. When sitewide conversion falls, the question is whether the site got worse or the traffic mix changed, and breaking the period down by channel can settle it in one query.
How to trigger it
Ask “which channel converts best?”, “how does mobile compare to desktop?”, “which countries are underperforming?”, or type /segment-analysis.
Like the other analysis skills, it runs two ways:
Quick answer. For a focused question — “how does mobile compare to desktop?” — one or two queries, a direct answer, and an offer to go deeper.
Full analysis. For a broad question or a bare /segment-analysis, the complete workflow ending in a ranked board.
Important: For marketing channels, this skill reports on-site behaviour from Noibu's own data — sessions, conversion rate, and revenue by UTM source, medium, and campaign. To bring ad-platform spend metrics such as cost, ROAS, or CPC into the same conversation to analyze, connect the relevant ad platform through Claude's own connector marketplace.
What you get
An overview card showing sitewide, mobile, and desktop conversion rate, with expandable tables for country performance and your best and highest-traffic channels.
Priority findings, each with an Investigate button.
An option to download the report, save it as a live dashboard, or schedule recurring insights. The default window is the last 30 days.
Acting on a finding
Clicking Investigate runs a focused follow-up. Depending on the finding, that may be:
A campaign breakdown — how performance varies between campaigns inside one channel
A landing page breakdown — where a country’s or a campaign’s traffic enters the site, and whether the entry point is the problem
A funnel stage breakdown — where in the funnel a specific segment drops off
From there, technical causes hand off to Tech Diagnosis. Non-technical causes — a UX issue, a campaign problem, a localization gap, a tracking gap — return one concrete recommended action, routed to whoever owns it, and the check that confirms it worked.
Real merchant use-case
A luxury accessories group found paid social converting at half the rate of organic traffic on mobile specifically, and redesigned the landing page mid-campaign. The gap was invisible at channel level and appeared only in the device-by-channel cut.