Developer Reproduction and Resolution from Session Replay
Last updated: March 20, 2026
Session replays offer developers a practical, contextualized view of bugs as they occurred for real users. By analyzing a session’s technical environment and behavioral timeline, engineers can more effectively diagnose root causes and implement targeted fixes. This article outlines how to leverage Noibu's playback tools, session metadata, and linked issues to support efficient debugging and resolution after being sent a link to a session replay.
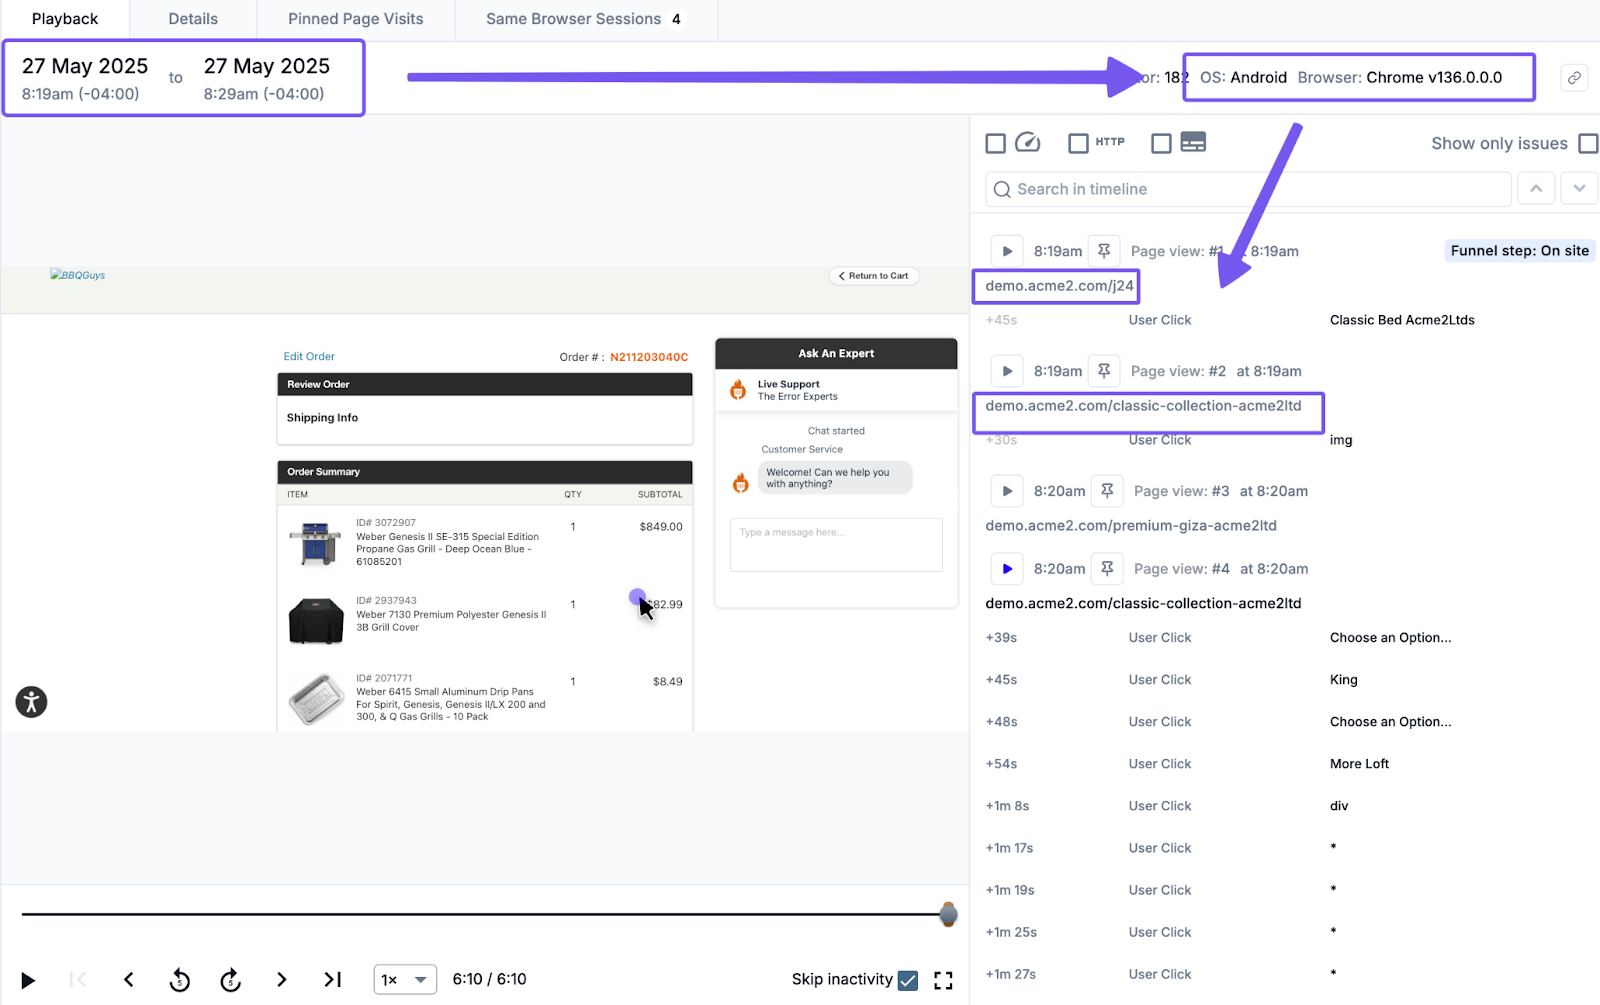
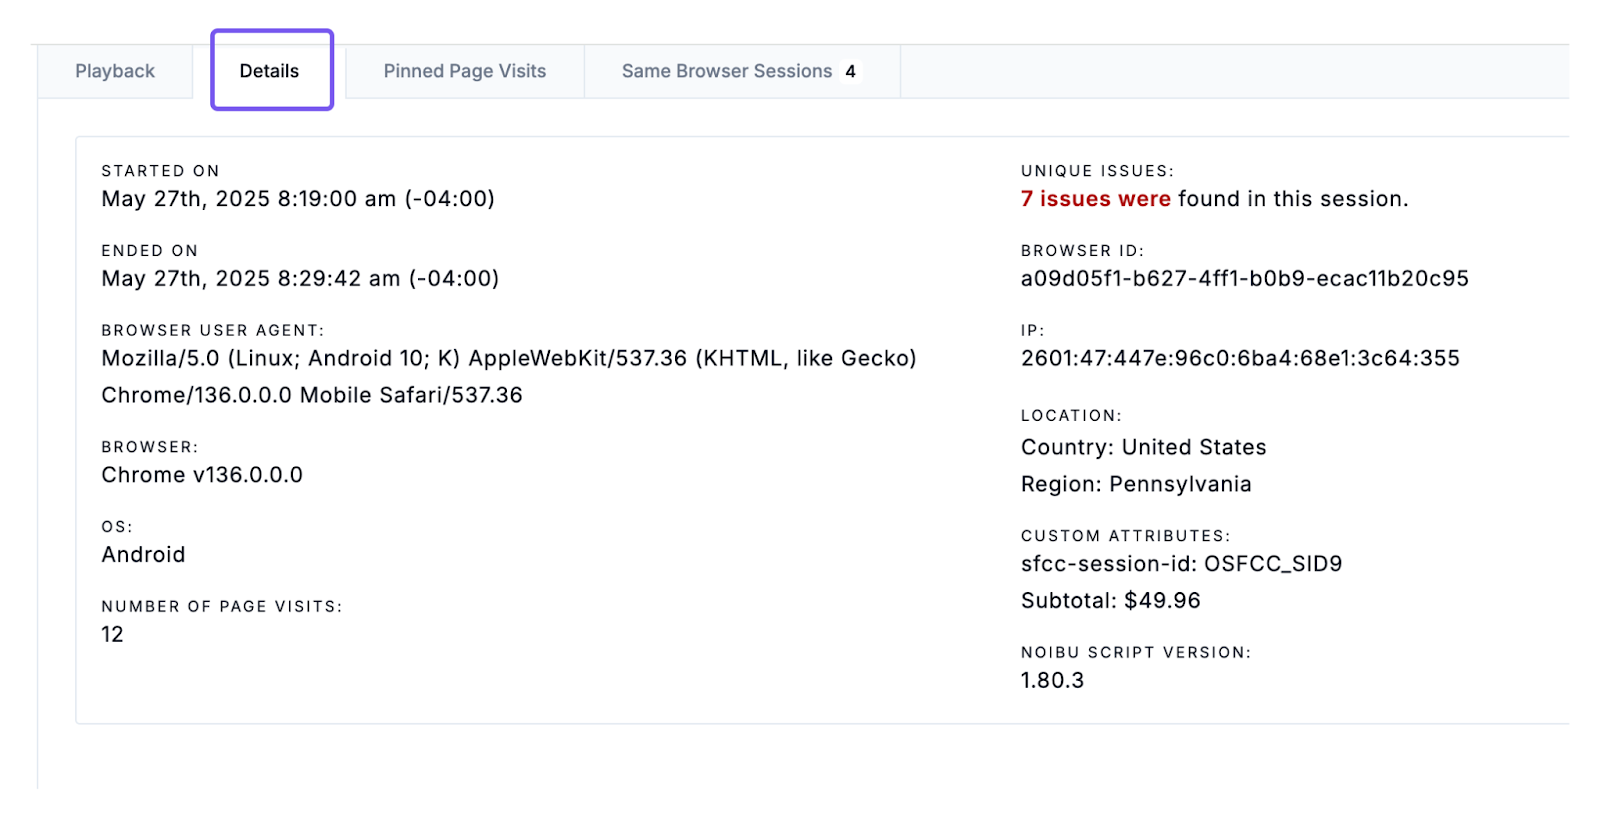
1. From the Session Details page, review the affected session:
Note the time of the session and the shopper’s browser, operating system, and URL during the issue.
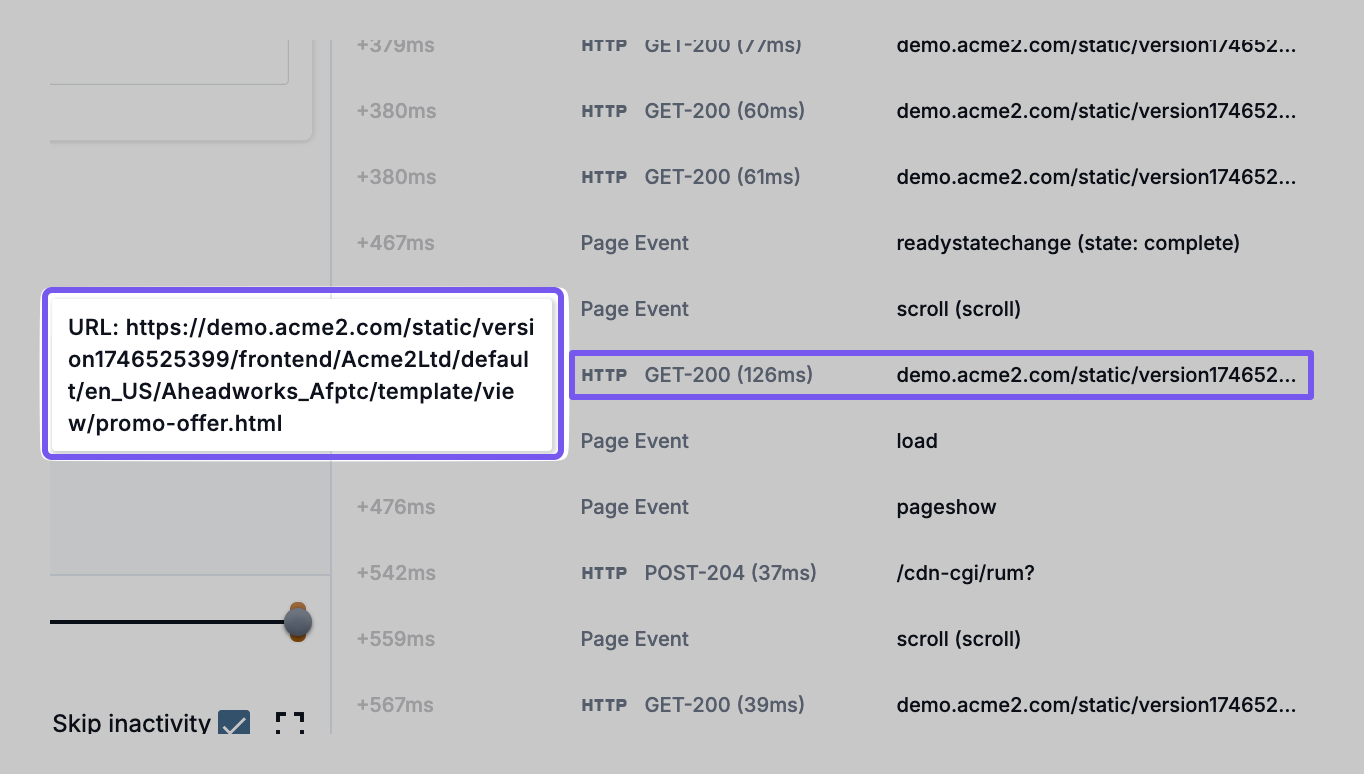
Enable technical overlays in playback: Web Vitals, HTTP events, and Page Lifecycle Events.

Hover over elements in the timeline for even more details.
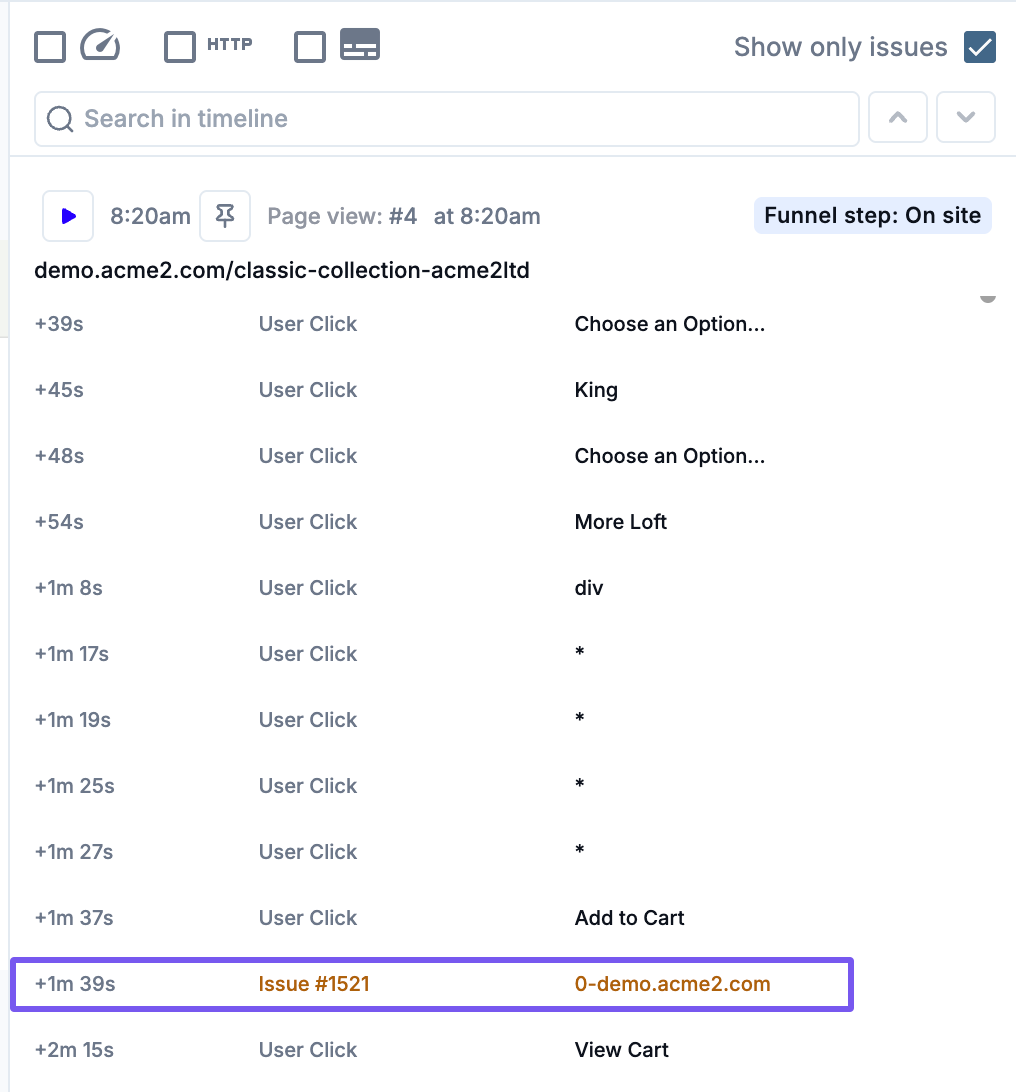
2. Analyze the session timeline and details:
Look for Session Symptoms, failure to progress through funnel stages, or specific interaction clues.
Click into Session Details for metadata like geolocation, device, and user journey context.
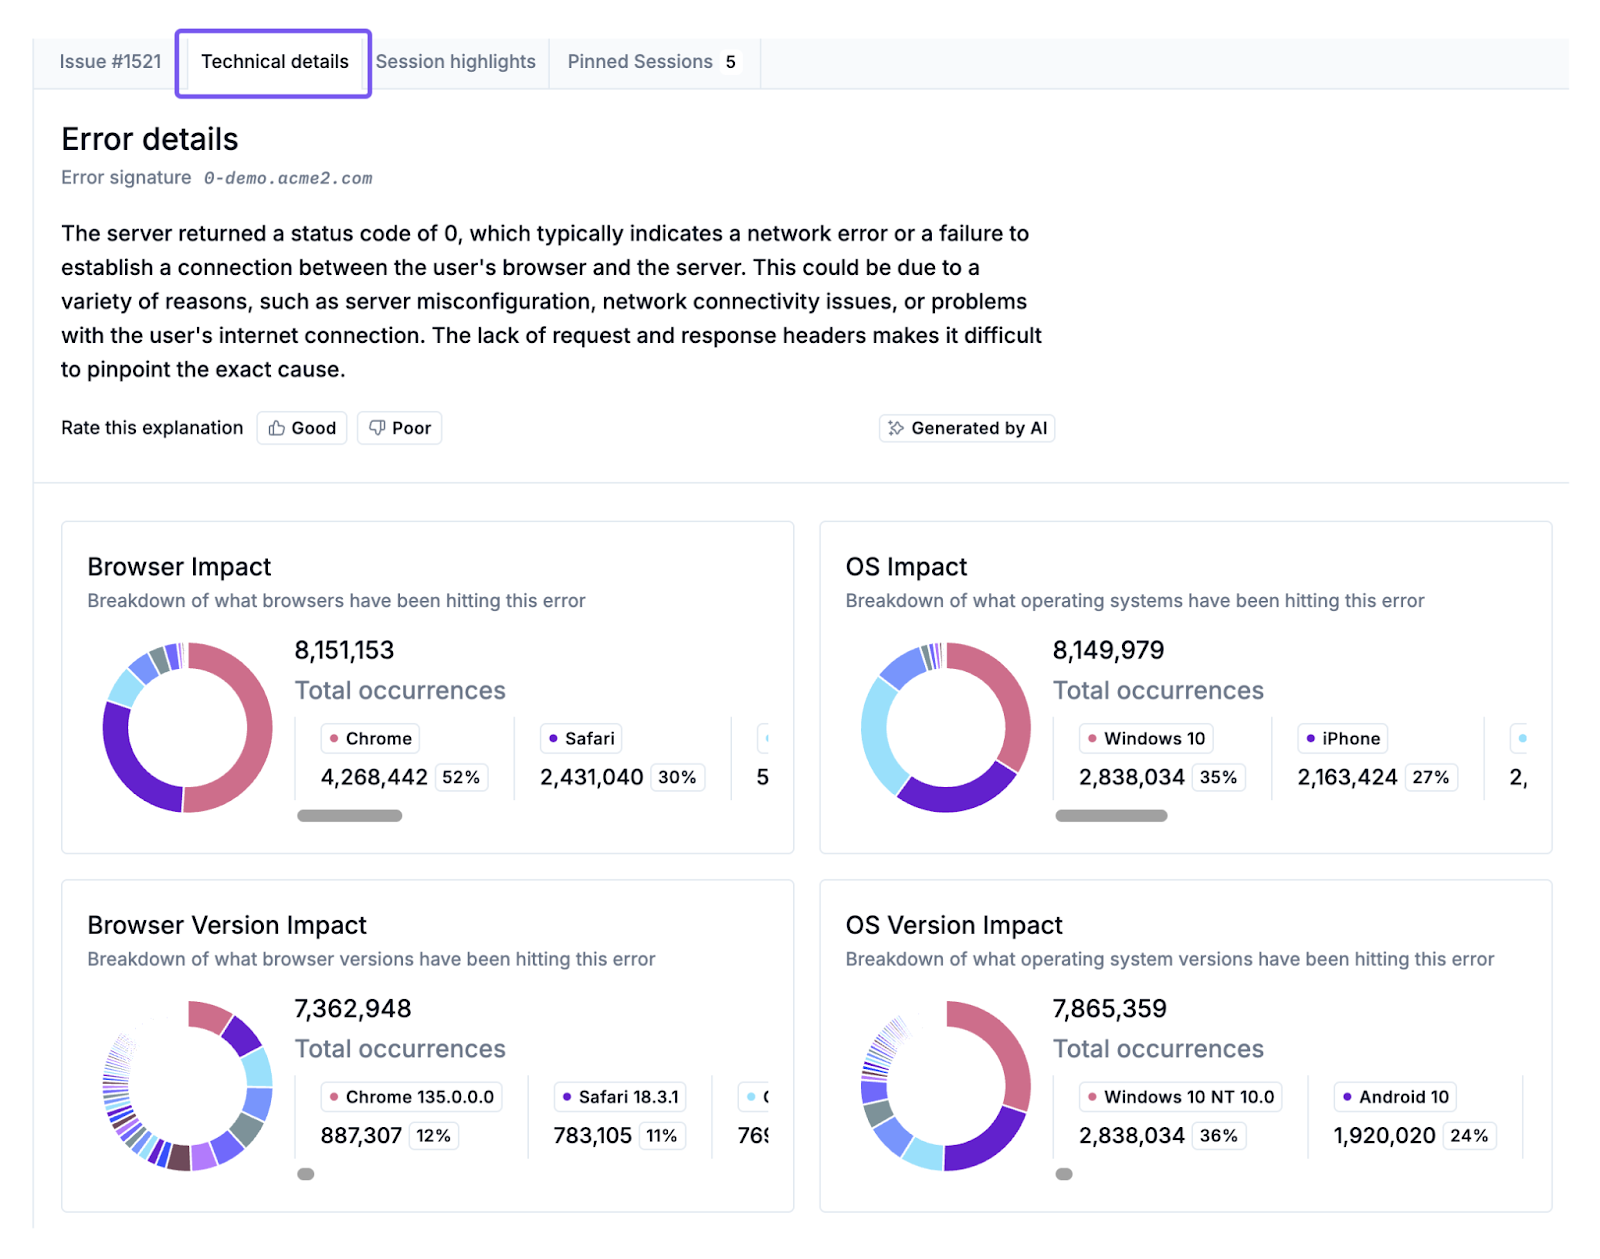
3. If applicable, click into the associated Issues to review other sessions related to the same issue, and gain more context on the underlying root-cause of the technical issue. Use all available context to reproduce the issue in a local or staging environment, and begin debugging and resolution.